- Gold price looks to extend the correction toward weekly lows of $1,911.
- Eyes on Federal Reserve’s preferred inflation data after United States Gross Domestic Product beat.
- Gold price rally falters amid a rebound in the US Dollar and US Treasury bond yields.
Gold price is on the back foot on Friday, eyeing a flat close for the week after hitting the highest level in nine months at $1,949 on Thursday. The United States Dollar (USD) is finding its feet alongside the US Treasury bond yields, with the focus now shifting toward the US Personal Consumption Expenditures (PCE) Price Index data.
Federal Reserve’s favorite inflation gauge in focus
The US Dollar is keeping its rebound intact against its major rivals for the second straight day, as the US Dollar Index looks to recapture the 102.00 level. The three-day recovery in the US Treasury bond yields is underpinning the sentiment around the US Dollar ahead of the United States Personal Consumption Expenditures (PCE) Price Index data for December. The US Federal Reserve (Fed) preferred gauge of inflation will be released later in the day at 13:30 GMT.
Economists are expecting the core PCE inflation, excluding volatile items like food and energy prices, to rise 0.2% on a monthly basis while the annualized rate is foreseen at 4.4% in the reported period. Easing of inflationary pressures in the United States could strengthen expectations of smaller US Federal Reserve rate hikes going forward or could even bolster odds of a Fed pause after the first quarter.
“Given the market positioning, there is little room for further US Dollar weakness in case PCE Price Index figures confirm the easing of price pressures. It’s also worth noting that investors are likely to refrain from making large bets only a few days ahead of the first FOMC policy meeting of the year,” FXStreet’s Senior Analyst Eren Sengezer explained.
Upbeat United States Q4 Gross Domestic Product fuels risk rally
The first estimate of the United States Gross Domestic Product data for the fourth quarter surpassed expectations of 2.6% to arrive at 2.9% YoY vs. the 3.2% clip. Recession fears somewhat eased after the US economic data, triggering a risk rally as the US tech shares climbed amid increased hopes of a soft landing. The US Dollar witnessed massive volatility on a host of US economic data releases but stood resilient, maintaining its recovery from eight-month troughs, which weighed heavily on the USD-denominated Gold price.
Among other top-tier United States data, weekly Jobless Claims fell by 6,000, down to 186,000 for the lowest reading since April 2022. US Durable Goods Orders data also were much better than expected, rising 5.6% for December, compared with the 2.4% estimate.
Gold price technical analysis: Daily chart
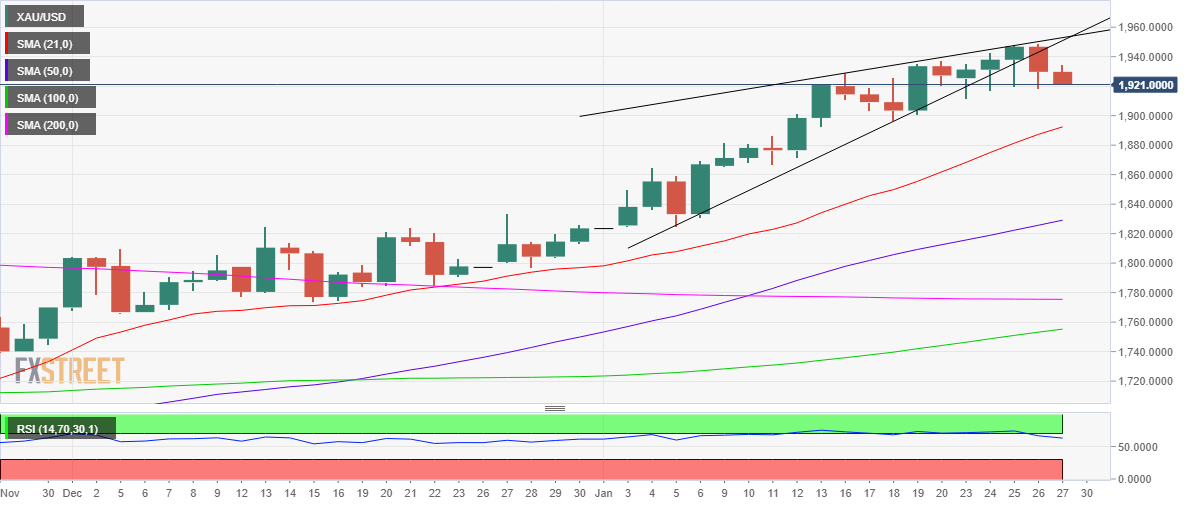
Having witnessed a fakeout to the upside from a rising wedge formation on Tuesday, bears took charge and triggered a corrective decline in the Gold price on Friday.
In doing so, Gold price closed the day below the lower boundary of the wedge, then at $1,940, validating a rising wedge breakdown. The natural tendency of the rising wedge is usually to yield a downside break, which eventually materialized on the United States Gross Domestic Product release.
Gold sellers need to crack a strong support near $1,918 to challenge the weekly low at $1,911. Should the correction deepen in the Gold price, the $1,900 round level could be put at risk.
With, the 14-day Relative Strength Index (RSI), however, in the positive territory above the midline, Gold price still remains a good buying opportunity on pullbacks.
On the upside, powerful resistance near the $1,950 psychological barrier remains a tough nut to crack for Gold bulls. Ahead of that, Gold price needs to find acceptance back above the $1,940 round figure.
A firm break above the $1,950 hurdle will call for a test of the next resistance placed around April 20 2022 highs near $1,958.