- Ethereum ETFs’ volume and inflows have been healthy despite ETHE heavy outflows, says Bloomberg analyst Eric Balchunas.
- Ethereum ETFs’ inflows are not from ETHE outflows, says analyst.
- Ethereum options expiry may trigger weekend volatility, but prices look set to improve in the long term.
Ethereum (ETH) is up nearly 4% on Friday following speculations that ETH ETFs’ inflows have been outflows from Grayscale Ethereum Trust (ETHE).
Daily Digest Market Movers: Why Ethereum ETFs may not be ‘small potatoes’
Ethereum ETFs took the major headline across the crypto market and parts of the traditional market this week as the banner of Bitwise Ethereum ETF (ETHW) was hung outside the New York Stock Exchange on Thursday.
The flag of ETH is raised over Wall Street.
And the SEC surrenders to a more powerful regulator.
Because it is Ethereum that now provides standardized market access to all Internet participants.
The network defeats the state.pic.twitter.com/7nlQCxXvWz
— Balaji (@balajis) July 26, 2024
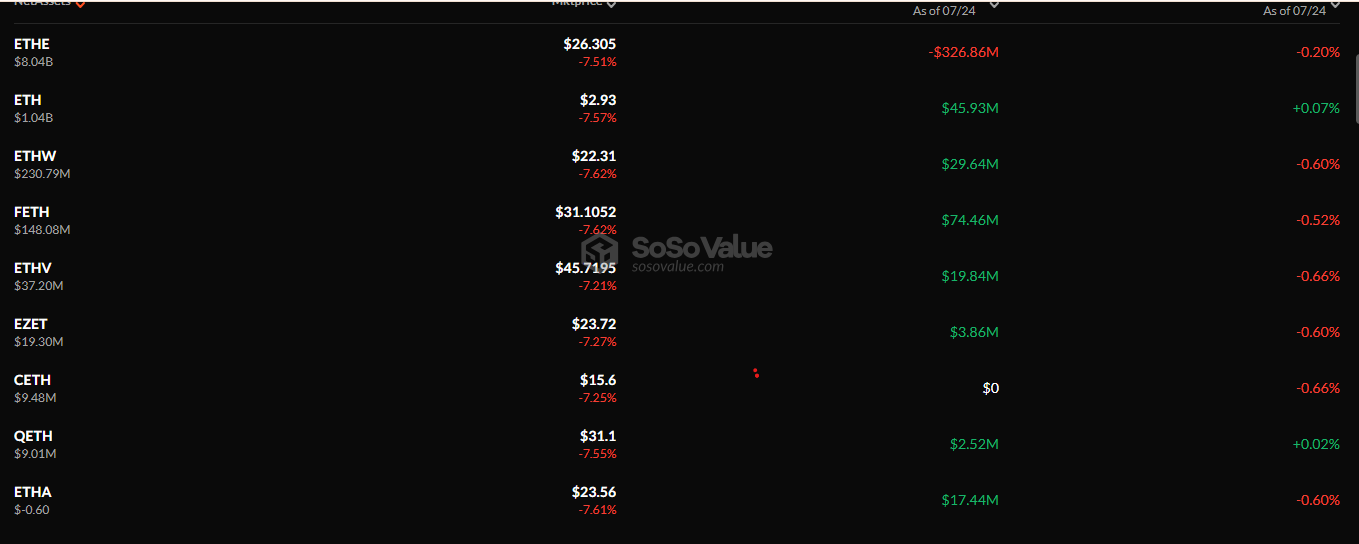
Ethereum ETFs’ debut week saw the products raking in a trading volume of over $800 million for four consecutive days. The “New Eight” weren’t able to muster enough inflows like the “New Nine Bitcoin ETFs” to offset outflows from Grayscale Ethereum Trust (ETHE). However, their inflows and trading volume are healthy, noted Bloomberg analyst Eric Balchunas.
Some crypto community members speculated that Ethereum ETFs may not have real demand as inflows into the “New Eight” may be outflows from ETHE. However, Balchunas debunked the sentiment, noting that two-thirds of the inflows may be new demand as ETHE outflows are probably from hedge funds.
“A big chunk of the outflows are HFs who arbed the $ETHE discount, and they’ve no interest in being long eth so they taking their profit and leaving,” wrote Balchunas in an X post. He also believes ETH investors shouldn’t focus on the first few weeks of outflows but lean on how issuers like BlackRock and Fidelity would preach the ETH investment case.
With the high rate of ETHE outflows, many expect its effect to taper off more quickly than that of GBTC. Hence, ETH’s price could reflect the demand from ETF investors more quickly than Bitcoin’s. However, this also means its price could experience steeper short-term declines than Bitcoin’s post-ETF launch.
ETH Technical Analysis: Ethereum options expiry could trigger weekend volatility
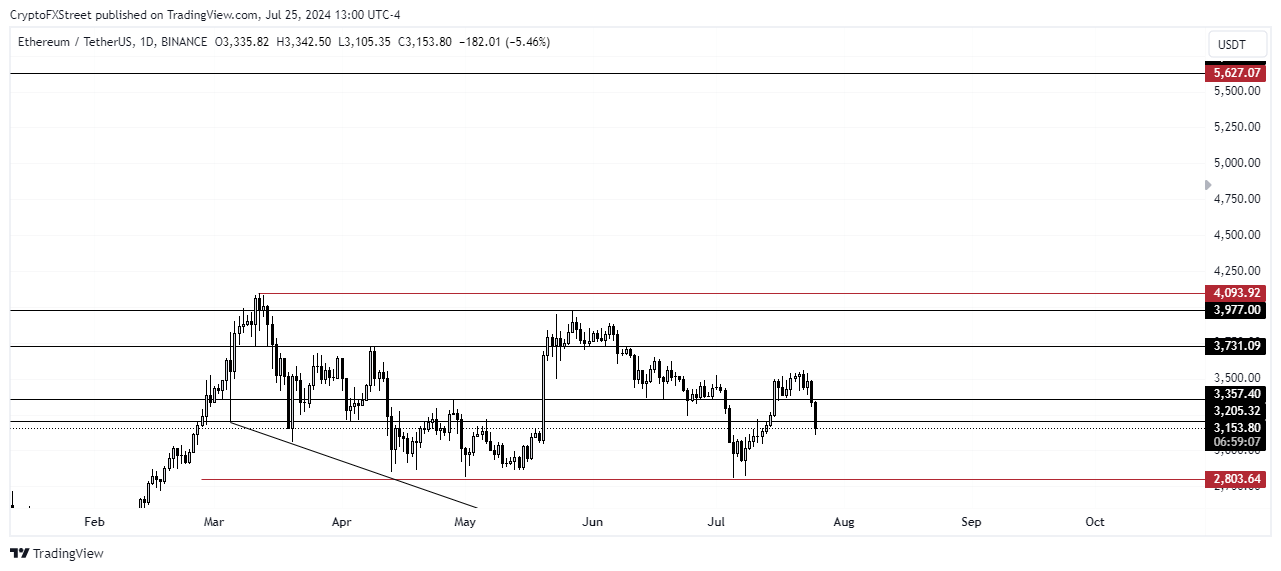
Ethereum is trading around $3,280 on Friday, up nearly 4% on the day. ETH 24-hour liquidations reached $52.18 million, with long and short liquidations accounting for $30.13 million and $21.87 million, respectively, according to Coinglass’ data.
ETH options with a notional value of $1.57 billion and a Put/Call Ratio of 0.46 expired today. Such heavy end-of-month options expiries often trigger high volatility, so ETH could experience huge price swings over the weekend.
The outlook appears to be turning positive for ETH after its recent rise, but outflows from ETHE could continue to weigh down on its price. As a result, ETH could enter a horizontal trend tilted towards the upside if the wider crypto market sentiment is positive. However, if the wider market turns bearish or uncertain, ETH could test support ranging from $2,852 to $2,803.
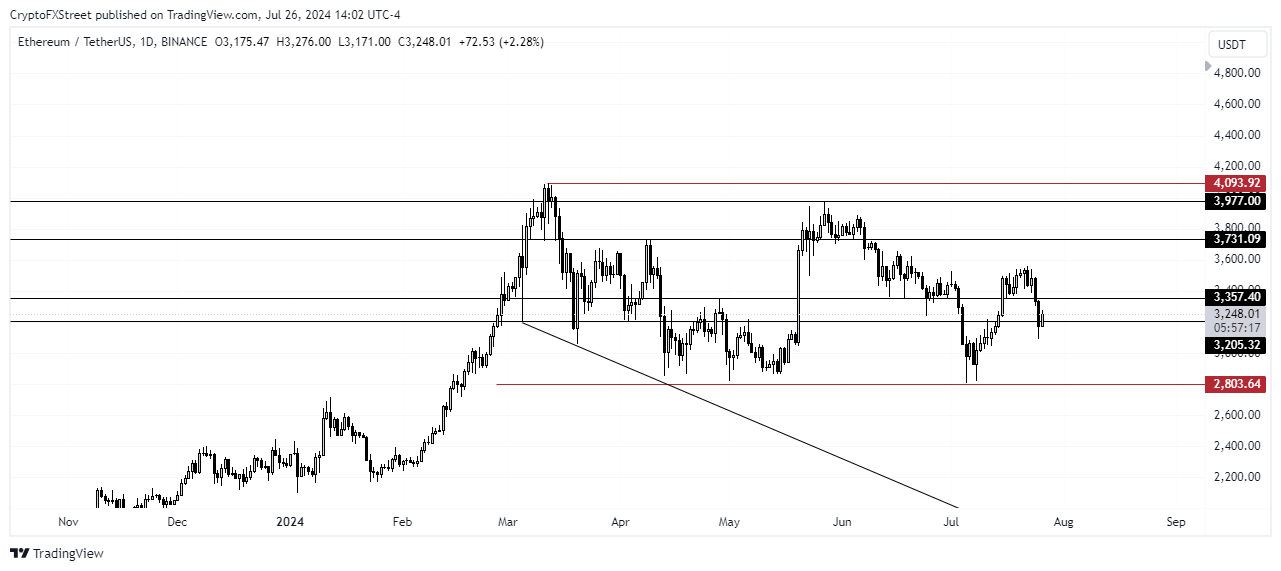
ETH/USDT Daily chart
In the long term, ETH could rally in the coming months after its Market Value to Realized Value (MVRV) Ratio bounced off its 365-day moving average. According to data from CryptoQuant, a price rally has often followed such a move as it indicates “price may have found a local bottom and could continue to increase.”
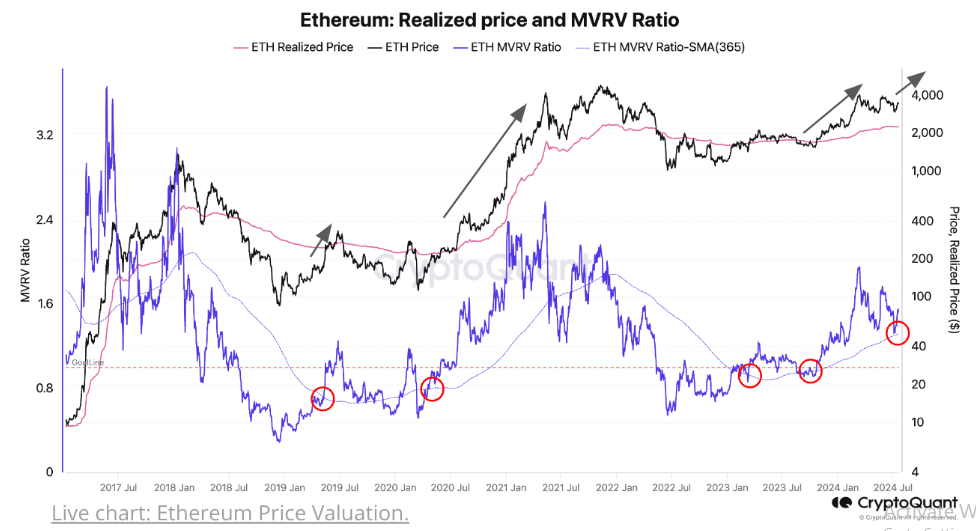
ETH Realized Price and MVRV Ratio
ETH could rise to $3,282 in the short term to liquidate $65.42 million worth of short positions.
Cryptocurrency metrics FAQs
The developer or creator of each cryptocurrency decides on the total number of tokens that can be minted or issued. Only a certain number of these assets can be minted by mining, staking or other mechanisms. This is defined by the algorithm of the underlying blockchain technology. Since its inception, a total of 19,445,656 BTCs have been mined, which is the circulating supply of Bitcoin. On the other hand, circulating supply can also be decreased via actions such as burning tokens, or mistakenly sending assets to addresses of other incompatible blockchains.
Market capitalization is the result of multiplying the circulating supply of a certain asset by the asset’s current market value. For Bitcoin, the market capitalization at the beginning of August 2023 is above $570 billion, which is the result of the more than 19 million BTC in circulation multiplied by the Bitcoin price around $29,600.
Trading volume refers to the total number of tokens for a specific asset that has been transacted or exchanged between buyers and sellers within set trading hours, for example, 24 hours. It is used to gauge market sentiment, this metric combines all volumes on centralized exchanges and decentralized exchanges. Increasing trading volume often denotes the demand for a certain asset as more people are buying and selling the cryptocurrency.
Funding rates are a concept designed to encourage traders to take positions and ensure perpetual contract prices match spot markets. It defines a mechanism by exchanges to ensure that future prices and index prices periodic payments regularly converge. When the funding rate is positive, the price of the perpetual contract is higher than the mark price. This means traders who are bullish and have opened long positions pay traders who are in short positions. On the other hand, a negative funding rate means perpetual prices are below the mark price, and hence traders with short positions pay traders who have opened long positions.
Source

%20-%20Kraken-638574929950904660.png)