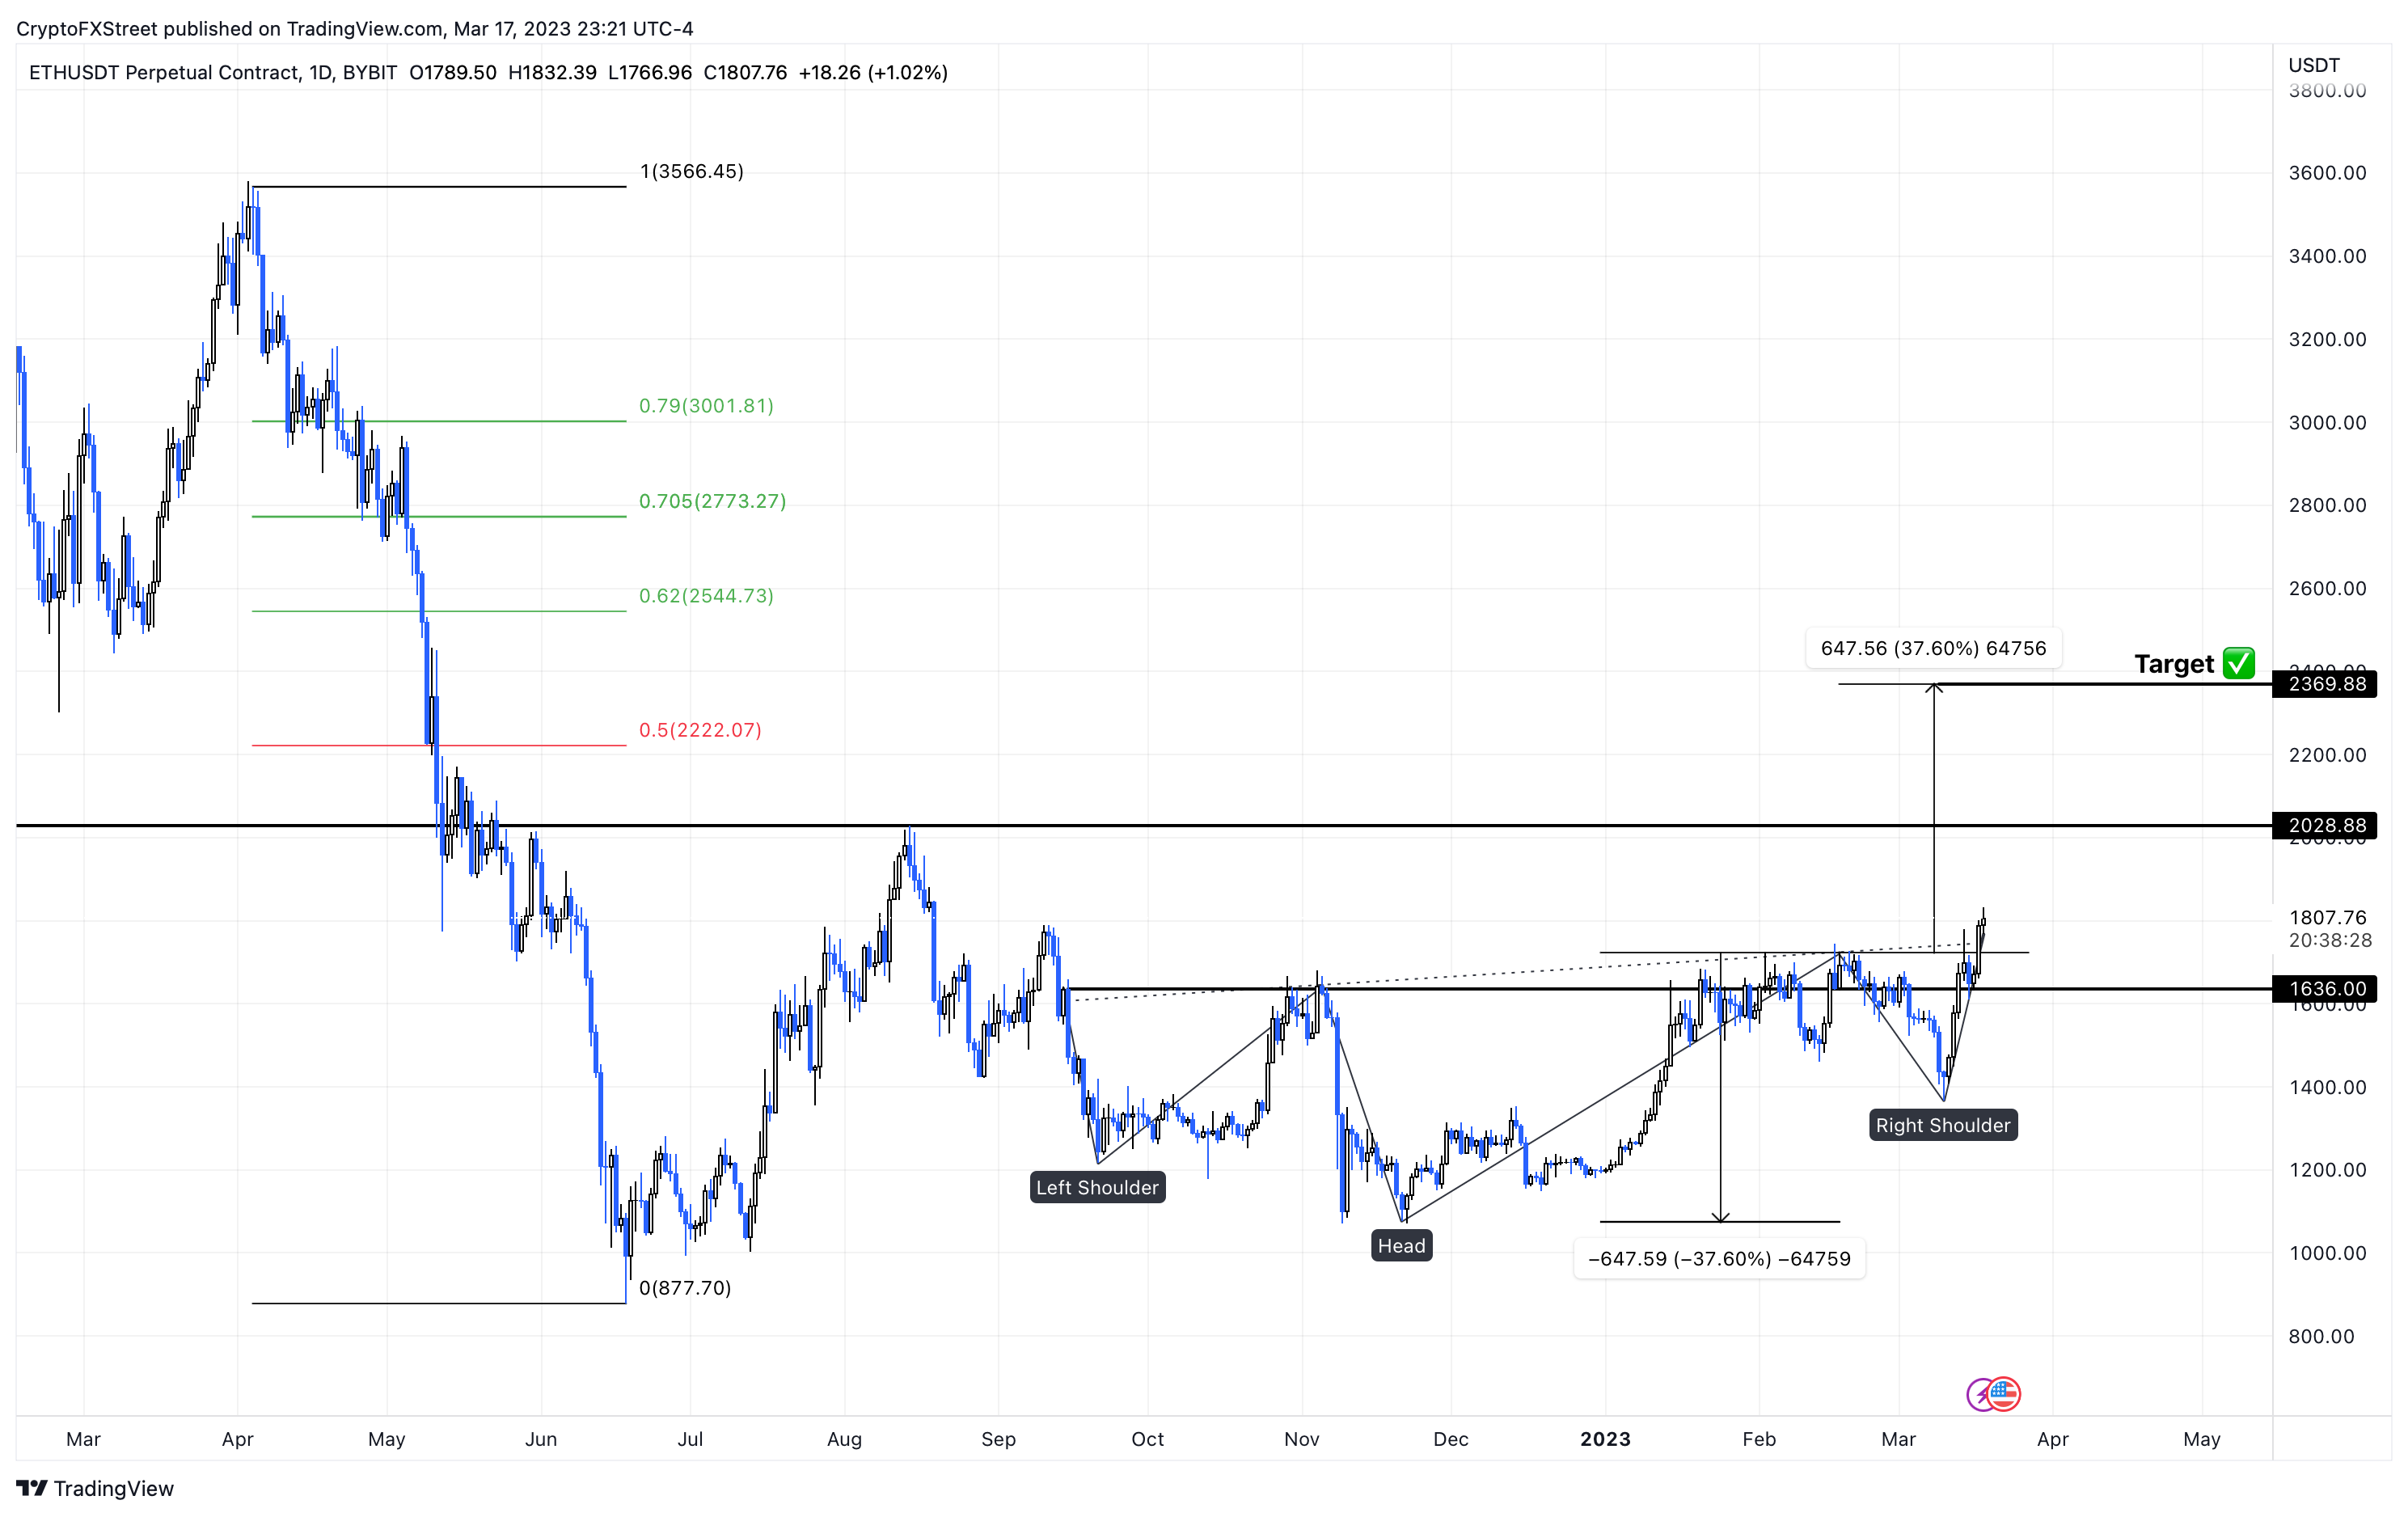
- Ethereum price action between September 2022 and mid-March 2023 reveals an inverse head-and-shoulders pattern.
- The forecast for this setup reveals a 37% move is incoming for ETH.
- Invalidation of the bullish theiss will occur on the breakdown of the neckline at $1,636.
Ethereum price has had an explosive start since March 10 as it attempted a retest of the upper limit of a multi-month consolidation. As ETH approached this level, it revealed a bullish pattern, a breakout from which could trigger a rally for the smart contract token despite the pressure from United States regulators.
Ethereum price hints at a bullish end to 2023’s first quarter
Ethereum price action set up an inverse head-and-shoulders pattern between September 2022 and mid-March 2023. This technical formation consists of three distinctive swing lows with the central one deeper than the other two.
The peaks between the valleys can usually be connected using a trend line to form a neckline. This level will determine if the Ethereum price has triggered a breakout and is key in making or breaking the setup.
The head-and-shoulders setup for Ethereum price forecasts a 37% upswing, determined by adding the distance between the right shoulder’s peak and the lowest point of the head and adding it to the breakout point at $1,636.
Ethereum price breached the neckline at $1,636 on March 13 and flipped this hurdle into a support level. This move initiated the aforementioned rally for ETH to the theoretical target of $2,370.
ETH/USDT 1-day chart
On the other hand, if Ethereum price shows weakness and massive profit-taking, it could put the recent gains in jeopardy. If ETH produces a daily candlestick close below $1,636 and flips into a resistance level, it will invalidate the bullish thesis.
In such a case, Ethereum price could revisit the $1,500 psychological level, where buyers can give the uptrend another go.
