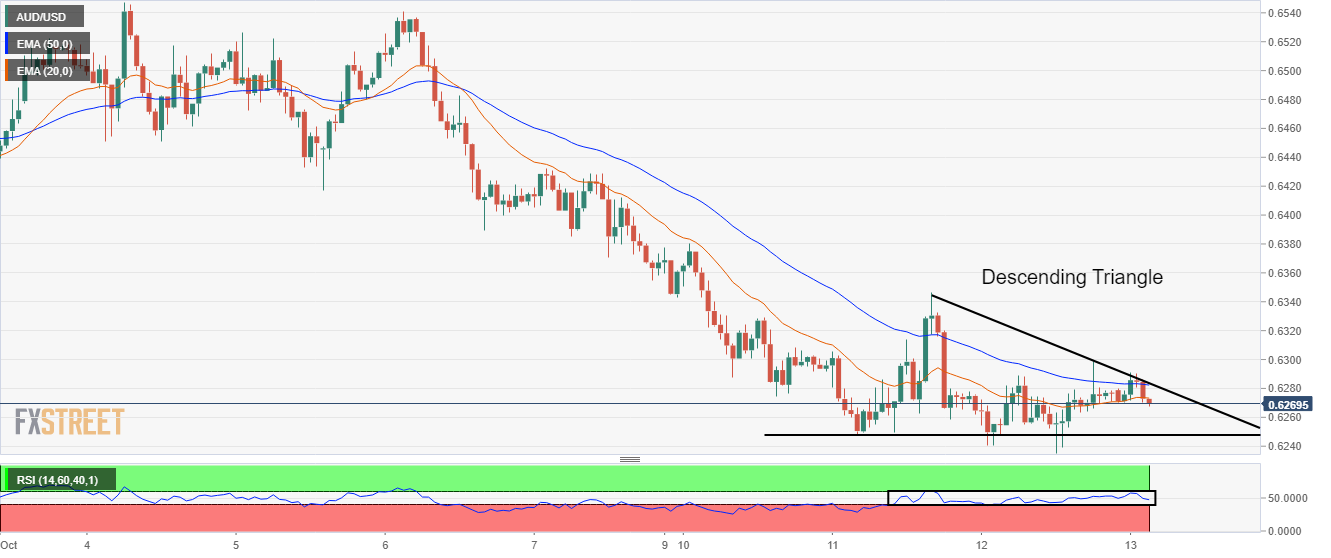
- A descending triangle formation indicates a volatility contraction in the asset.
- Aussie bulls have failed to keep the asset above the 20-and 50EMAs.
- The downside break of the chart pattern could drag the asset below the psychological support of 0.6000.
The AUD/USD pair has sensed selling pressure while attempting to test Wednesday’s high at 0.6300 in the Tokyo session. The pullback move in the asset has terminated as the risk-off impulse has rebounded amid soaring anxiety ahead of the US Consumer Price Index (CPI). Meanwhile, the US dollar index (DXY) has recovered its morning losses.
On an hourly scale, the asset is auctioning in a descending triangle chart pattern that indicates volatility contraction followed by wider ticks and heavy volume after an explosion. The horizontal support of the chart pattern is plotted from Tuesday’s low at 0.6247. While the downward-sloping trendline is placed from Tuesday’s high at 0.6346.
The antipodean has failed to keep the asset above the 20-and 50-period Exponential Moving Averages (EMAs) at 0.6274 and 0.6282 respectively.
Meanwhile, the Relative Strength Index (RSI) (14) is oscillating in a 40.00-60.00 range and has faced barricades while overstepping 60.00.
A downside break of Wednesday’s low at 0.6240 will drag the asset toward the round-level support at 0.6200 followed by April 2020 low at 0.5991.
On the flip side, a decisive break above October 4 high at 0.6548 will drive the asset toward the round-level resistance at 0.6600. A breach of the latter will expose the asset to smash the 50-EMA at 0.6661.
