- Bitcoin price gained momentum on June 1, increasing the odds for the crypto king to rally north.
- BTC could make a 10% leap to tag the $30,000 level enticed by the liquidity cluster above that level.
- The bullish outlook will be invalidated upon a decisive candlestick close below $25,188
Bitcoin (BTC) price is up almost 70% since the onset of 2023, surviving turbulence due to US macroeconomics, chaos in traditional finance, and a heated regulatory climate. After all that resilience, BTC now has a chance to make a run for the ambitious target of $30,000 even as the industry continues to escape the bear market.
Also Read: Bitcoin Weekly Forecast: BTC targets $30,000 as short-term bias turns bullish
Bitcoin price readies for a 10% run-up
Bitcoin (BTC) price is trading with a bullish bias, restoring hopes of a rally toward the $30,000 target. The newly found bullishness comes amid growing momentum that has elevated BTC by almost 5% between June 1 and 3.
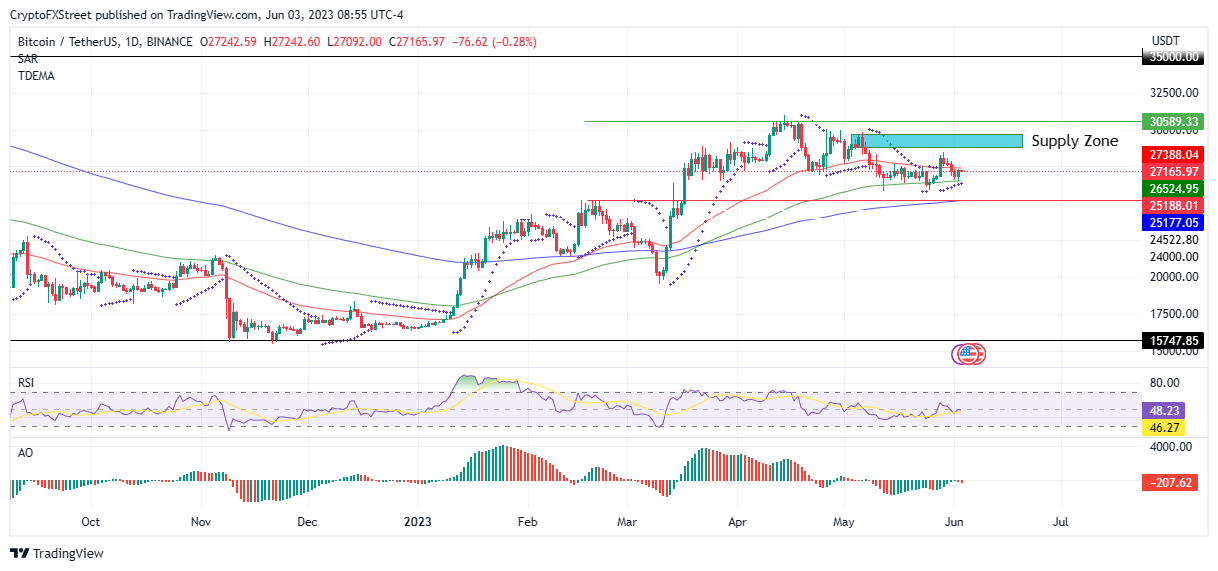
An increase in buyer momentum thereof could give Bitcoin price the requisite torque to sustain the uptrend. Meanwhile, BTC continues to tap from an influx of buying pressure due to the 100-day Exponential Moving Average (EMA) at $26,524.
Bolstered by a growing buyer momentum, traders can expect Bitcoin price to approach the supply zone between the $28,808 and $29,790 range, where all big sellers are located. If this cohort of market participants keeps their selling appetite in check or buyer momentum overpowers selling pressure, Bitcoin price could break past this zone to tag the $30,000 level. Such a move would denote a 10% ascension.
In a highly bullish case, Bitcoin price could ascend further to hit $35,000, levels last seen on May 8, when the Terra ecosystem collapsed.
The growing momentum indicated by the rising Relative Strength Index (RSI) and the Awesome Oscillators (AO) supports this optimistic outlook, with both indicators edging toward the midline. Furthermore, there was robust support down beyond the $100-day EMA, indicated by the confluence between the horizontal line and the 200-day EMA at $25,188.
A decisive move above the $30,000 level could allow Bitcoin price to collect the liquidity cluster above that level, tipping the odds more in favor of bulls.
BTC/USDT 1-Day Chart
On the other hand, the 50-day EMA at $27,288 continues to limit the upside for Bitcoin price. Selling pressure from this level has been sustained since May 10. Unless bulls can overpower this group of investors, their stop loss orders, coupled with that indicated by the supply zone, could just be what prevent BTC from reaching its target.
This is true considering the RSI had difficulty sustaining the northbound inclination, and the AO gave room for more red.
On-chain metrics: GIOM
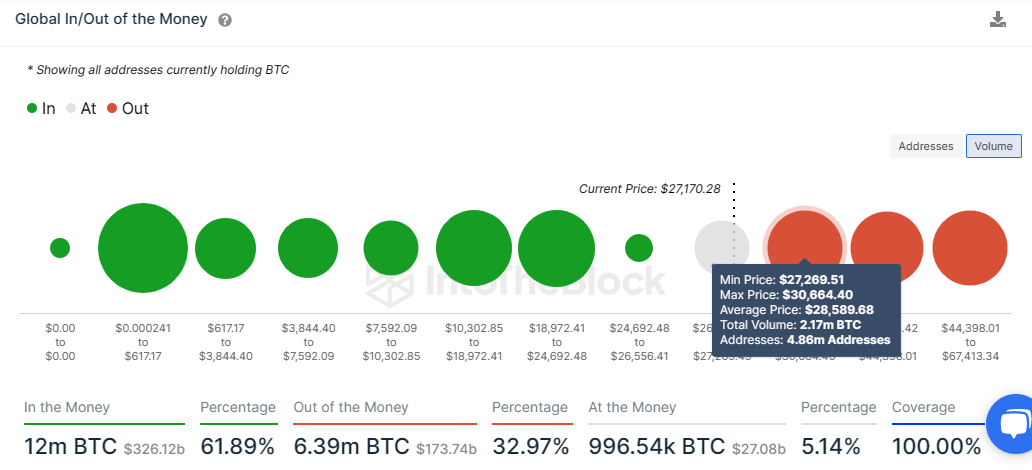
On-chain metrics from IntoTheBlock’s Global In/Out of the Money (GIOM) shows that there was robust resistance between the $27,269 and $30,664 range.
Any attempts to move Bitcoin price higher would be met by selling pressure from 4.86 million addresses who bought approximately 2.17 million BTC at an average price of $28,589.

