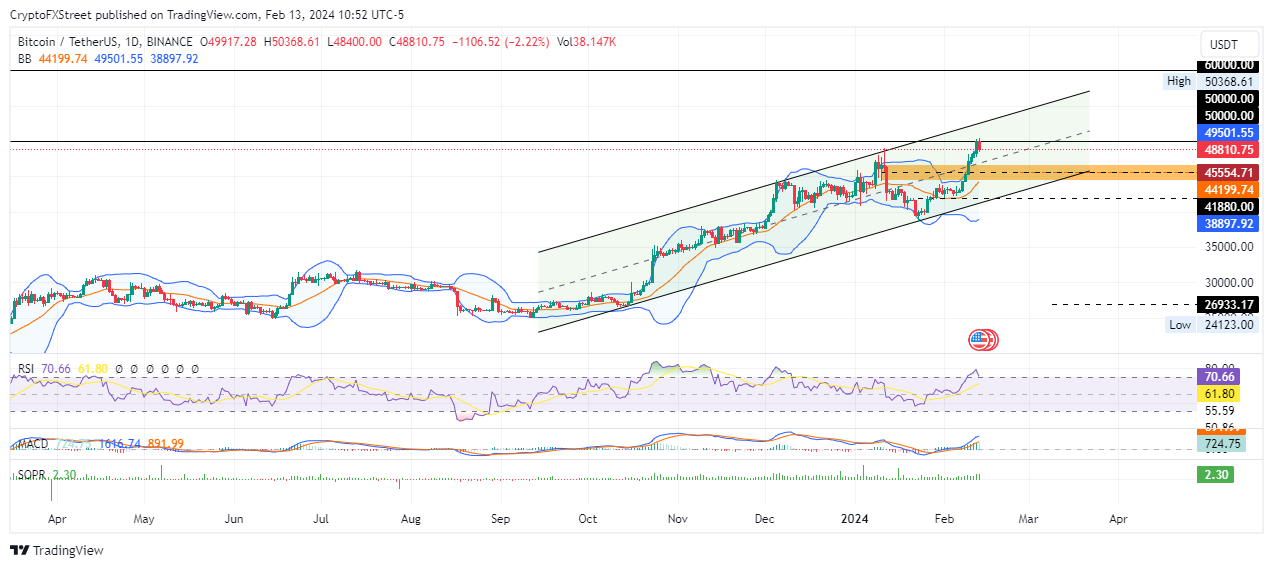
- Bitcoin price shocked the market on Monday, hitting the $50,000 milestone after two long years.
- BTC could drop 5% into the supply zone turned bullish breaker or confirm an extended fall below $45,554.
- A higher-high above the $50,368 range high would invalidate the bearish thesis, bringing $60,000 into focus.
- US CPI inflation in January printed at 3.1% on a yearly basis, above the 2.9% market expectation.
After hitting the $50,000 milestone on Monday, Bitcoin price has pulled back, coming on the back of US CPI Inflation data on Tuesday, which showed that the possibility of a rate cut remains hopium, at least for now.
Also Read: Bitcoin price hits $50,000 as Wall Street buys BTC en masse
Cryptocurrency metrics FAQs
The developer or creator of each cryptocurrency decides on the total number of tokens that can be minted or issued. Only a certain number of these assets can be minted by mining, staking or other mechanisms. This is defined by the algorithm of the underlying blockchain technology. Since its inception, a total of 19,445,656 BTCs have been mined, which is the circulating supply of Bitcoin. On the other hand, circulating supply can also be decreased via actions such as burning tokens, or mistakenly sending assets to addresses of other incompatible blockchains.
Market capitalization is the result of multiplying the circulating supply of a certain asset by the asset’s current market value. For Bitcoin, the market capitalization at the beginning of August 2023 is above $570 billion, which is the result of the more than 19 million BTC in circulation multiplied by the Bitcoin price around $29,600.
Trading volume refers to the total number of tokens for a specific asset that has been transacted or exchanged between buyers and sellers within set trading hours, for example, 24 hours. It is used to gauge market sentiment, this metric combines all volumes on centralized exchanges and decentralized exchanges. Increasing trading volume often denotes the demand for a certain asset as more people are buying and selling the cryptocurrency.
Funding rates are a concept designed to encourage traders to take positions and ensure perpetual contract prices match spot markets. It defines a mechanism by exchanges to ensure that future prices and index prices periodic payments regularly converge. When the funding rate is positive, the price of the perpetual contract is higher than the mark price. This means traders who are bullish and have opened long positions pay traders who are in short positions. On the other hand, a negative funding rate means perpetual prices are below the mark price, and hence traders with short positions pay traders who have opened long positions.
US CPI shows inflation remains stubbornly high
US Consumer Price Index (CPI) numbers for January arrived on Tuesday morning. Per the reading, headline inflation came in hot at 3.1% in January on a yearly basis, higher than consensus expectations of 2.9%. It comes after December’s 3.4% reading.
Despite the dip between December and January, the uptick from expectations signals persistent inflationary pressure as all inflation figures, whether monthly, core, annual or headline, were higher than the consensus. Amid stubborn inflation, risk-off sentiment for the markets prevails, causing the risk-on alternatives such as equities and BTC to fall.
This bout of stubborn inflation means that the Fed is unlikely to cut interest rates in the near term.
Read US CPI inflation declines to 3.1% in January vs. 2.9% forecast
Bitcoin price repels $50,000 amid US CPI inflation woes
After a landmark $50,000 retest, Bitcoin price has taken to a load-shedding exercise with technical indicators suggesting an extended fall. A 5% conservative target would reach the supply zone (turned bullish breaker) between $44,300 and $46,760. A break and close below the midline of this order block at $45,554 would confirm the continuation of the fall. This could see BTC test the $41,880 support.
Multiple technical indicators suggested an extended fall for Bitcoin price, starting with the Relative Strength Index (RSI) almost crossing below the 70 level to show BTC is ripe for selling after being overbought.
The price has also broken above the upper band of the Bollinger indicator, reinforcing the overbought supposition, meaning a pullback is likely due.
More importantly, Bitcoin price’s current Spent Output Profit Ratio (SOPR) indicates a possible correction. This is because it has increased above 1 as a 30-day moving average (MA). For the layperson, this ratio suggests that BTC holders who are sitting on unrealized profits at current Bitcoin prices may soon cash in on their gains.
These features suggest a possible correction at this point. In this respect, investors should not succumb to the fear of missing out (FOMO) and should consider waiting for the SOPR rate to fall below 1 before they can enter the market.
BTC/USDT 1-day chart
On the flip side, if buying pressure increases, Bitcoin price could reclaim the $50,000 landmark, or higher to clear the $50,368 range high. A decisive candlestick close above this level would invalidate the bearish thesis. In a highly bullish case, BTC could extend a neck higher to the $60,000 psychological level, nearly 25% above current levels.
Source
