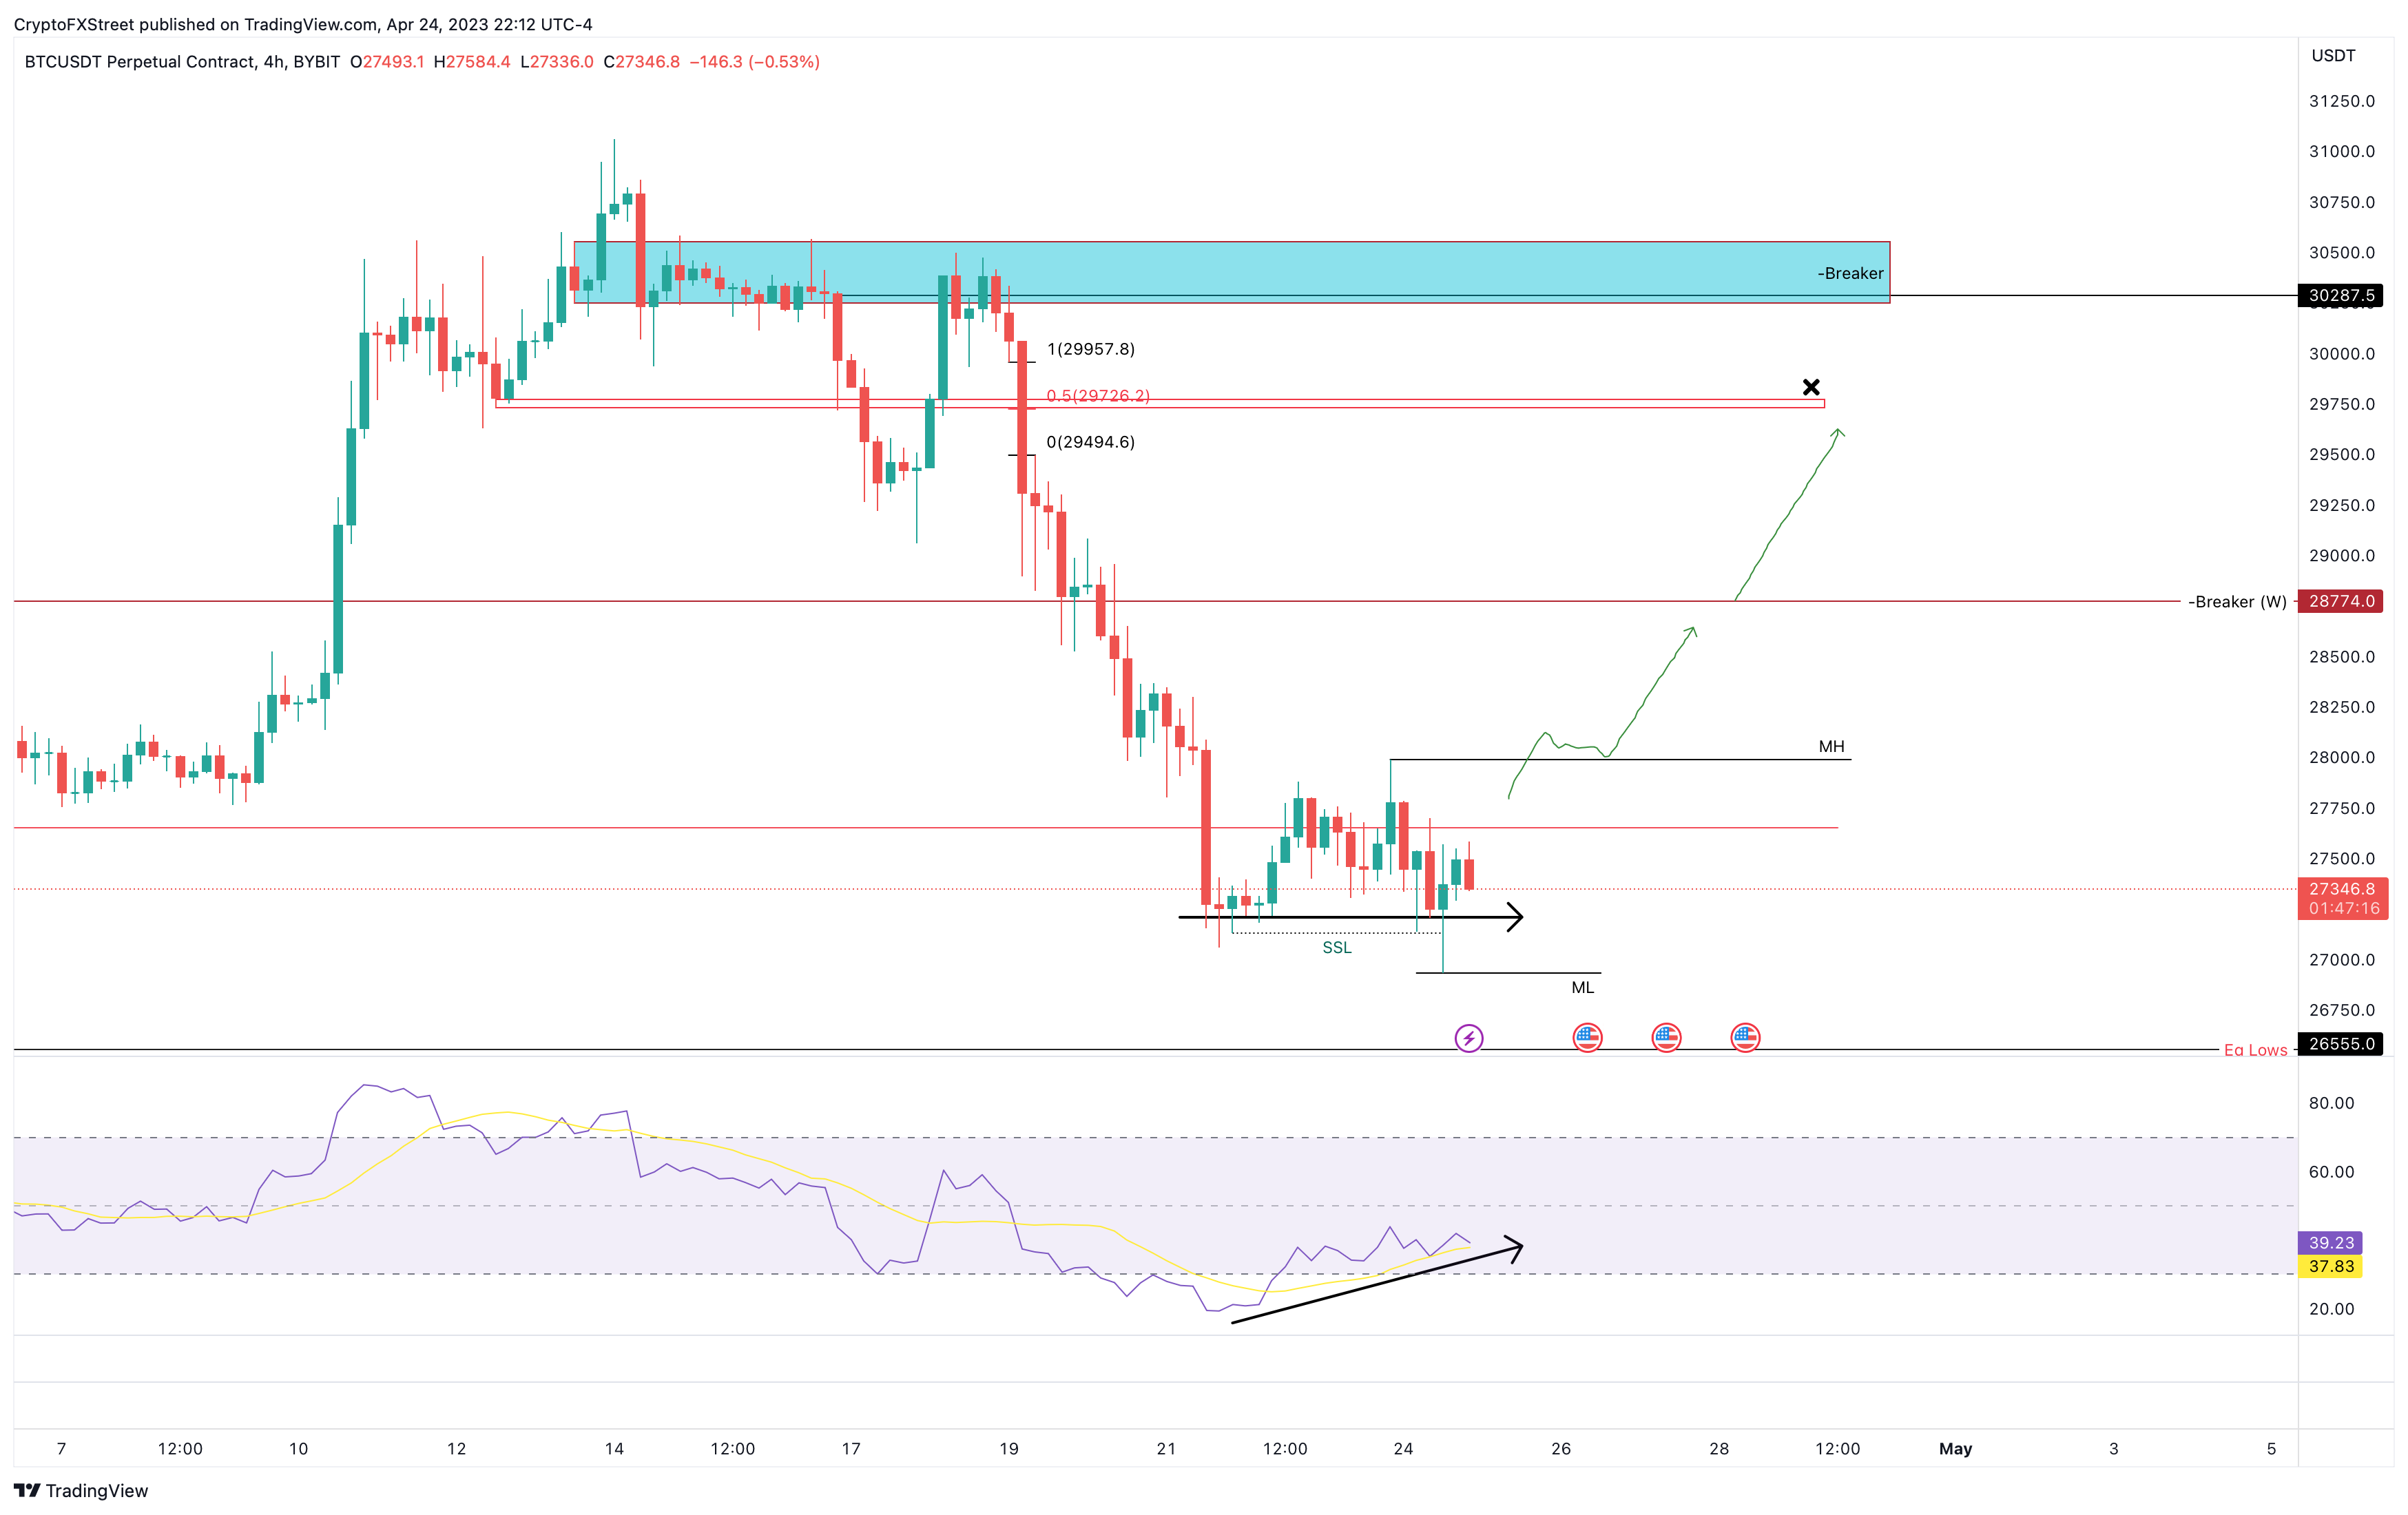
- Bitcoin price reveals an exaggerated bullish divergence on the four-hour chart.
- This setup forecasts a bullish move for BTC that could propel it to $29,726.
- A four-hour candlestick close below $26,555 will create a lower low and invalidate the bullish thesis.
Bitcoin price shows a bullish setup in formation, hinting at an optimistic start to the week. If this technical formation plays out, BTC could be due for a quick recovery rally that could retest a key psychological level.
Also read: Bitcoin price action from 2019 hints what could happen to BTC in 2023
Bitcoin price awaits a trigger
Bitcoin price kick-started its descent on April 18 as it retested the bearish breaker setup. As a result, BTC shed 11% over the next five days. As BTC consolidates around $27,231, the narrative is starting to improve.
The four-hour chart shows Bitcoin price forming equal lows in terms of candlestick bodies, while the Relative Strength Index (RSI) has been setting up higher lows. This non-conformity is termed ‘exaggerated bullish divergence’ and often leads to an ascent in the underlying asset’s price.
For Bitcoin price, a breakout from this setup could lead to a quick recovery rally that retests the $28,774 and $29,774 hurdles. The latter is significant since it coincides with the midpoint of the four-hour Fair Value Gap (FVG), extending from $29,494 to $29,957.
In some cases, Bitcoin price could extend higher and tag the $30,000 psychological level.
BTC/USDT 4-hour chart
The short-term bullish outlook for Bitcoin price makes sense from a logical standpoint, but the volatility could continue to chop around for longer than anticipated. If the selling pressure spikes due to the upcoming macroeconomic events, the bulls’ plans could turn against them.
If Bitcoin price produces a four-hour candlestick close below $26,555, it will create a lower low and invalidate the bullish thesis. In such a case, BTC could slide 5.30% and tag the $25,175 support level.
