- Bitcoin price briefly tagged $70,000 on Monday before a quick retraction but still holds above $69,000.
- BTC halving is around 26 days away, likely to happen on April 20 based on Nice Hash countdown.
- Grayscale outflows against inflows from BlackRock and Fidelity shows market dynamics influencing BTC price.
Bitcoin (BTC) price recently provided a buying opportunity for late bulls and sidelined investors when it retracted to the $62,000 range. As it now trades above $69,000, skeptics could or could not have another buying opportunty before BTC clears its $73,777 peak.
Also Read: Week Ahead: Altcoin bulls vs. Bitcoin bears, who will win?
Any other buying opportunity for Bitcoin before halving?
Two main narratives have been driving the Bitcoin market since the fourth quarter of 2023. First, the oncoming halving and secondly the spot BTC exchange-traded funds (ETFs) theme that is already at play. The countdown according to hash power marketplace Nice Hash shows the halving to be around 27 days away from the expected day of April 20.
Block halving events happen every four years or 210,000 blocks on Bitcoin blockchain. From an initial block reward of 50 BTC, the current block reward is 6.25 BTC and is expected to be slashed in half to 3.125 BTC, lowering the rate of BTC token generation. The resulting scarcity is a bullish fundamental for Bitcoin price.
The “buy the rumor” situation is already at play, causing the likes of Robert Kiyosaki to anticipate more gains and committed to increasing his Bitcoin portfolio by 10 BTC tokens. The author of bestseller Rich Dad, Poor Dad also advocates for Gold and Silver purchases.
I am buying 10 more Bitcoin before April. Why? The “Having.” If you can’t afford a whole Bitcoin you may want to consider buying 1/10 of a coin, via the new ETFs or Satoshi’s.
If the Bitcoin process works as designed you may own a whole Bitcoin by the end of this year.
I…
— Robert Kiyosaki (@theRealKiyosaki) March 25, 2024
Along with the halving theme, markets are also riding atop the spot BTC ETF narrative. Over the past few weeks, outflows from the Grayscale ETF, GBTC, have been a bearish fundamental for the Bitcoin price. However, recent reports indicate a counterforce due to inflows from the BlackRock and Fidelity BTC ETFs, IBIT and FBTC, respectively.
BlackRock and Fidelity now own a combined 379,151 BTC worth $26.1 Billion for their spot Bitcoin ETFs. This is about 22,711 tokens higher than Grayscale’s 356,440 after it moved 266,470 for GBTC redemption recently.
ETF analyst from Bloomberg Intelligence contends with the angle that GBTC outflows are a show of boomers’ weak hands. However, as Grayscale outflows increase, inflows continue to increase for BlackRock and Fidelity, likely because of differences in discounts. Citing one user on X, @mbeiser,
Figured if Grayscale believes all I should get is spot minus 1.5% (per year), I’d find a more friendly home for my money. As for those saying Grayscale needs money to pay for the lawsuit, we paid 2% FOR YEARS.
In hindsight, a recent report by Arkham Intelligence indicated that at the current rate of redemptions, (25.9K BTC per week), GBTC is expected to run out of Bitcoin to sell in 96 days. Grayscale has transferred 266.47K BTC out of their wallets for GBTC redemptions since the product hit the market on January 11, with the holdings moving from 618.28K BTC to 356.44K BTC as of March 23.
Open Interest, funding rate FAQs
Bitcoin price outlook as halving and ETF narratives flank markets
Bitcoin price uptrend saw the pioneer cryptocurrency tag $70,000 on Monday with prospects for more short-term gains. To confirm the continuation of the uptrend, however, BTC price must break and close above $72,197 on the daily time frame, a level that marks the midline of a supply zone extending from $71,124 to $73,271.
A decisive candlestick close above the $72,197 midline could see Bitcoin price clear the $73,777 peak to record a new all-time high on Binance against the Tether (USDT) stablecoin. The Relative Strength Index (RSI) is also teasing with a pending bullish crossover. If it crosses above the yellow band of the signal line, it could inspire more buy orders to reinvigorate the uptrend.
The green histogram on the Awesome Oscillator (AO) indicates budding bullish sentiment.
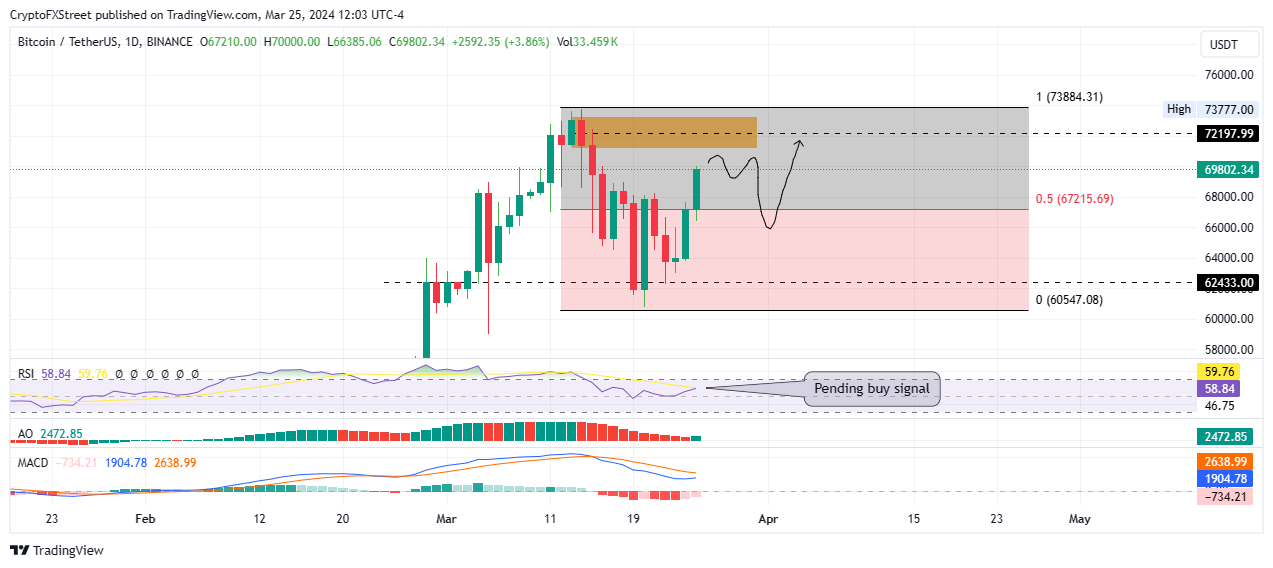
BTC/USDT 1-day chart
However, with the histograms of the Moving Average Convergence Divergence (MACD) still in the red and in negative territory, coupled with the position of the MACD below the signal line, BTC price is still in the thicket.
Reduced buying pressure could see the bears take over, writing off all the ground covered on Monday. This means Bitcoin price could descend below the 50% Fibonacci placeholder at $67,215 for a liquidity grab before a potential move north.
Source