- Bitcoin price retracted to a low of $70,543 on Binance, causing over $250 million in liquidations.
- A UK judge has determined that Craig Wright is not Satoshi Nakamoto and that he did not create BTC.
- Sidelined and late investors could have another buying opportunity before the next leg up ahead of halving.
Bitcoin (BTC) price rally has lost steam, retracting below the $70,000 threshold briefly. It comes following reports that Craig Wright is in fact not the creator of Bitcoin, Satoshi Nakamoto.
Also Read: Bitcoin cleared $70,000 and Ethereum, $4,000: What’s next for crypto?
UK Judge says Craig Wright is not Bitcoin creator Satoshi Nakamoto
The identity of Bitcoin’s creator, the pseudonymous Satoshi Nakamoto, has remained a mystery for years. Among the prominent theories include:
- Nick Szabo – Computer scientist and cryptographer
- Hal Finney – Cryptographic pioneer and the first person to receive a Bitcoin transaction from Satoshi Nakamoto
- Dorian Nakamoto – he denied any involvement after a discovery article in 2024
- Craig Wright – Australian computer scientist who claimed he is Satoshi with cryptographic evidence to support his claim.
- A Group of Individuals – There are theories that Satoshi is not a single person.
However, at least one theory might now be put to rest. A high court judge in London cited “overwhelming evidence” after a two-month trial that Craig Wright is not Satoshi Nakamoto.
The presiding judge, Mr Justice Mellor, said, “…having considered all the evidence and submissions presented to me in this trial, I’ve reached the conclusion that the evidence is overwhelming,” and committed to issuing a “fairly lengthy written judgment” in due course. According to a report on The Guardian, Justice Mellor summarized:
- Wright is not the author of the Bitcoin white paper
- Wright is not the person who adopted or operated under the pseudonym Satoshi Nakamoto in the period 2008 to 2011
- Wright is not the person who created the Bitcoin system
- He is not the author of the initial versions of the Bitcoin software
It all comes after a conglomerate of cryptocurrency companies, dubbed Crypto Open Patent Alliance (Copa), levied charges against Wright. The objective was to prevent him from claiming he had invented Bitcoin as he was already using this to expand his influence over the crypto sector.
Nevertheless, while Wright may not be the elusive inventor, the quest for Satoshi’s true identity continues, with the anonymity adding to the intrigue that surrounds the creation of Bitcoin and its impact on the world of finance and technology.
The news created waves in the BTC market. After advancing toward the $80,000 milestone, Bitcoin price has pulled back to record an intraday low of $70,605 against the Tether (USDT) stablecoin on Binance Exchange. The move resulted in over $250 million in total liquidations, comprising $181 million in long positions against $70 million in short positions across the market.
Total liquidations
In the BTC market, almost $70 million worth of positions were blown out of the water, comprising $56 million longs against $13 million in short positions. In a 24-hour span, BTC open interest rose by $63 million, from $35.8 billion to $36.4 billion between Wednesday and Thursday. This comprises the sum of all open short and long positions for the pioneer cryptocurrency.
Bitcoin price outlook as judge denies claims of Wright being Satoshi
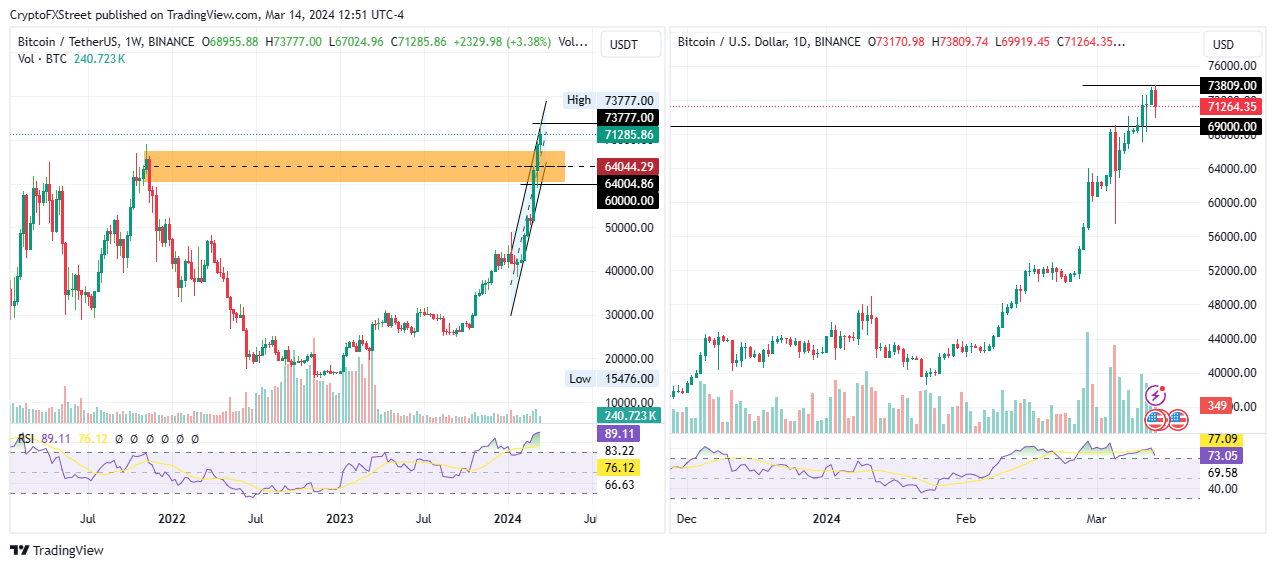
Bitcoin price dipped to an intraday low of $70,543 on Binance and $69,919 on Coinbase against USDT and USD, respectively. Nevertheless, the big-picture outlook remains strongly bullish. The slump could provide a good buying opportunity for investors as the BTC market heats up ahead of the halving.
BTC/USDT 1-week chart, BTC/USD 1-day chart
If the bulls seize the opportunity to buy the correction, Bitcoin price could push north, clearing the range high at $73,777. Enhanced buying pressure could see the apex crypto record a new all-time high at $75,000 or, in a highly bullish case, tag the $80,000 milestone. This would denote a climb of about 10% above current levels.
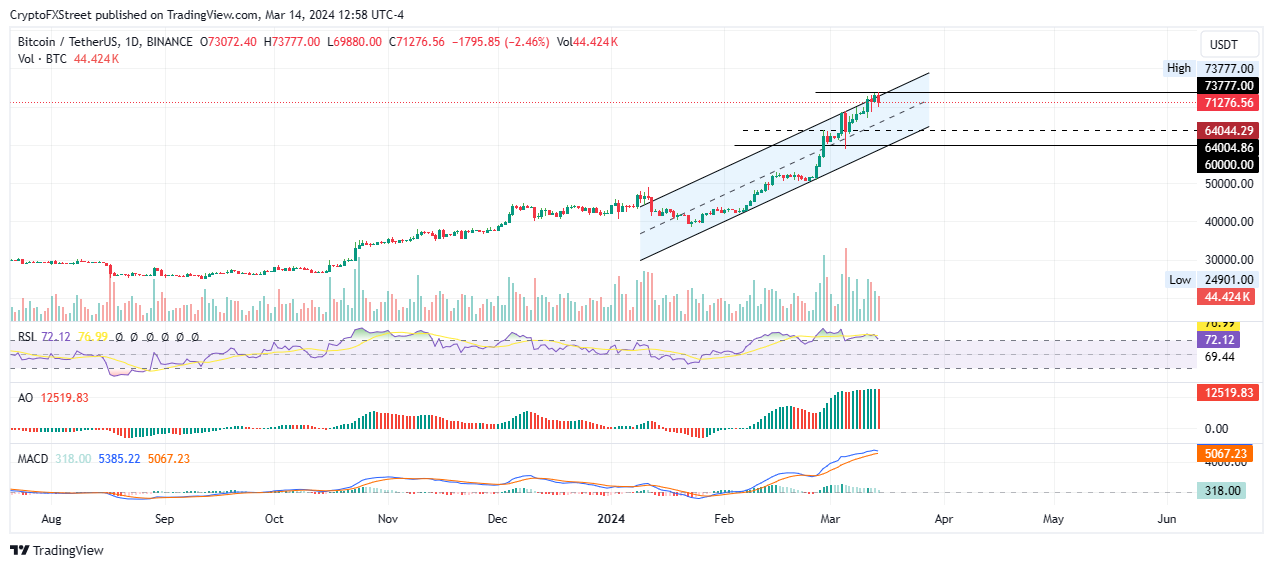
Multiple technical indicators support this outlook, starting with the Moving Average Convergence Divergence (MACD) moving well above the orange band of the signal line. This suggests a strong bullish cycle, accentuated by the large bars of the volume indicator.
Also, the Awesome Oscillator is well above the midline. The position of the Relative Strength Index (RSI) also points to a strong price strength, adding credence to the bullish thesis.
BTC/USDT 1-day chart
On the other hand, the RSI is dropping to show falling momentum. If the trajectory extends and the RSI crosses below the 70 threshold, it would trigger a sell signal. This could see Bitcoin price fall back below the $69,000 threshold, or in a dire case, extend a leg lower to tag the $60,000 psychological level. This would denote a 15% fall below current levels. Sidelined and later buyers could have an opportunity to buy the dip here.
Also Read: Bitcoin price continues to rise, but do not ignore strong signals of correction
Cryptocurrency metrics FAQs
The developer or creator of each cryptocurrency decides on the total number of tokens that can be minted or issued. Only a certain number of these assets can be minted by mining, staking or other mechanisms. This is defined by the algorithm of the underlying blockchain technology. Since its inception, a total of 19,445,656 BTCs have been mined, which is the circulating supply of Bitcoin. On the other hand, circulating supply can also be decreased via actions such as burning tokens, or mistakenly sending assets to addresses of other incompatible blockchains.
Market capitalization is the result of multiplying the circulating supply of a certain asset by the asset’s current market value. For Bitcoin, the market capitalization at the beginning of August 2023 is above $570 billion, which is the result of the more than 19 million BTC in circulation multiplied by the Bitcoin price around $29,600.
Trading volume refers to the total number of tokens for a specific asset that has been transacted or exchanged between buyers and sellers within set trading hours, for example, 24 hours. It is used to gauge market sentiment, this metric combines all volumes on centralized exchanges and decentralized exchanges. Increasing trading volume often denotes the demand for a certain asset as more people are buying and selling the cryptocurrency.
Funding rates are a concept designed to encourage traders to take positions and ensure perpetual contract prices match spot markets. It defines a mechanism by exchanges to ensure that future prices and index prices periodic payments regularly converge. When the funding rate is positive, the price of the perpetual contract is higher than the mark price. This means traders who are bullish and have opened long positions pay traders who are in short positions. On the other hand, a negative funding rate means perpetual prices are below the mark price, and hence traders with short positions pay traders who have opened long positions.
Source


