- Canadian Dollar backslides across the board after net jobs contract.
- Canada printed the second net negative jobs figure in 2024.
- Losses limited against the Greenback after sharp revisions to US NFP.
The Canadian Dollar broadly soured on Friday, getting pushed to the floorboards after Canadian Net Change in Employment printed a contraction for the second time in 2024 and missing forecasts by a wide margin. US Nonfarm Payrolls (NFP) beat forecasts, but steep revisions to previous figures helped to reignite hopes for a September rate cut.
Canada also reported a higher-than-expected increase in the Unemployment Rate. However, still rising wage pressures and increased Ivey Purchasing Managers Index (PMI) activity surveys bode poorly for future rate cuts as bellwethers of inflation pressures continue to build after the Bank of Canada (BoC) raced to cut rates in 2024.
Daily digest market movers: Canadian Dollar takes a dive as bad data sours risk-on chances
- Canadian Net Change in Employment in June sharply missed forecasts, printing at -1.4K MoM versus the previous 26.7K, far below the forecast of 22.5K.
- Canadian Unemployment Rate also ticked higher in June, rising to 6.4% from the previous 6.2%, running above the forecast for 6.3%.
- Canadian Average Hourly Wages rose 5.6% YoY in June, accelerating from the previous 5.2%.
- Canadian Ivey PMIs in June rose to 62.4 from the previous 59.1.
- US NFP net job gains handily beat forecasts, clocking in at 206K versus the forecast of 190K. However, the previous month’s figure was sharply revised lower to 218K from the initial print of 272K.
- US Average Hourly Earnings came in as expected, growing 3.9% YoY through June and cooling slightly from the previous 4.1%.
- With wage pressures easing and after-the-fact revisions chilling US NFP labor data, markets are again piling into bets of a September rate cut from the Federal Reserve (Fed). According to the CME’s FedWatch Tool, rate traders are pricing in nearly 80% odds of at least a quarter-point rate trim on September 18.
Canadian Dollar PRICE Today
The table below shows the percentage change of Canadian Dollar (CAD) against listed major currencies today. Canadian Dollar was the strongest against the US Dollar.
| USD | EUR | GBP | JPY | CAD | AUD | NZD | CHF | |
|---|---|---|---|---|---|---|---|---|
| USD | -0.13% | -0.31% | -0.24% | 0.18% | -0.20% | -0.29% | -0.26% | |
| EUR | 0.13% | -0.19% | -0.10% | 0.32% | -0.07% | -0.16% | -0.14% | |
| GBP | 0.31% | 0.19% | 0.10% | 0.52% | 0.13% | 0.03% | 0.03% | |
| JPY | 0.24% | 0.10% | -0.10% | 0.41% | 0.05% | -0.06% | -0.04% | |
| CAD | -0.18% | -0.32% | -0.52% | -0.41% | -0.39% | -0.46% | -0.47% | |
| AUD | 0.20% | 0.07% | -0.13% | -0.05% | 0.39% | -0.09% | -0.07% | |
| NZD | 0.29% | 0.16% | -0.03% | 0.06% | 0.46% | 0.09% | -0.01% | |
| CHF | 0.26% | 0.14% | -0.03% | 0.04% | 0.47% | 0.07% | 0.00% |
The heat map shows percentage changes of major currencies against each other. The base currency is picked from the left column, while the quote currency is picked from the top row. For example, if you pick the Canadian Dollar from the left column and move along the horizontal line to the US Dollar, the percentage change displayed in the box will represent CAD (base)/USD (quote).
Technical analysis: Canadian Dollar pares recent gains, snaps three-day win streak against Greenback
The Canadian Dollar (CAD) fell across the board on Friday, unceremoniously ending a three-day winning streak against the US Dollar (USD) and paring away Thursday’s gains as the CAD fell a fifth of a percent against the USD. An overall weaker US Dollar on Friday helped to limit losses, with the Canadian Dollar falling one-half of one percent against the Pound Sterling (GBP), Japanese Yen (JPY) and Swiss Franc (CHF).
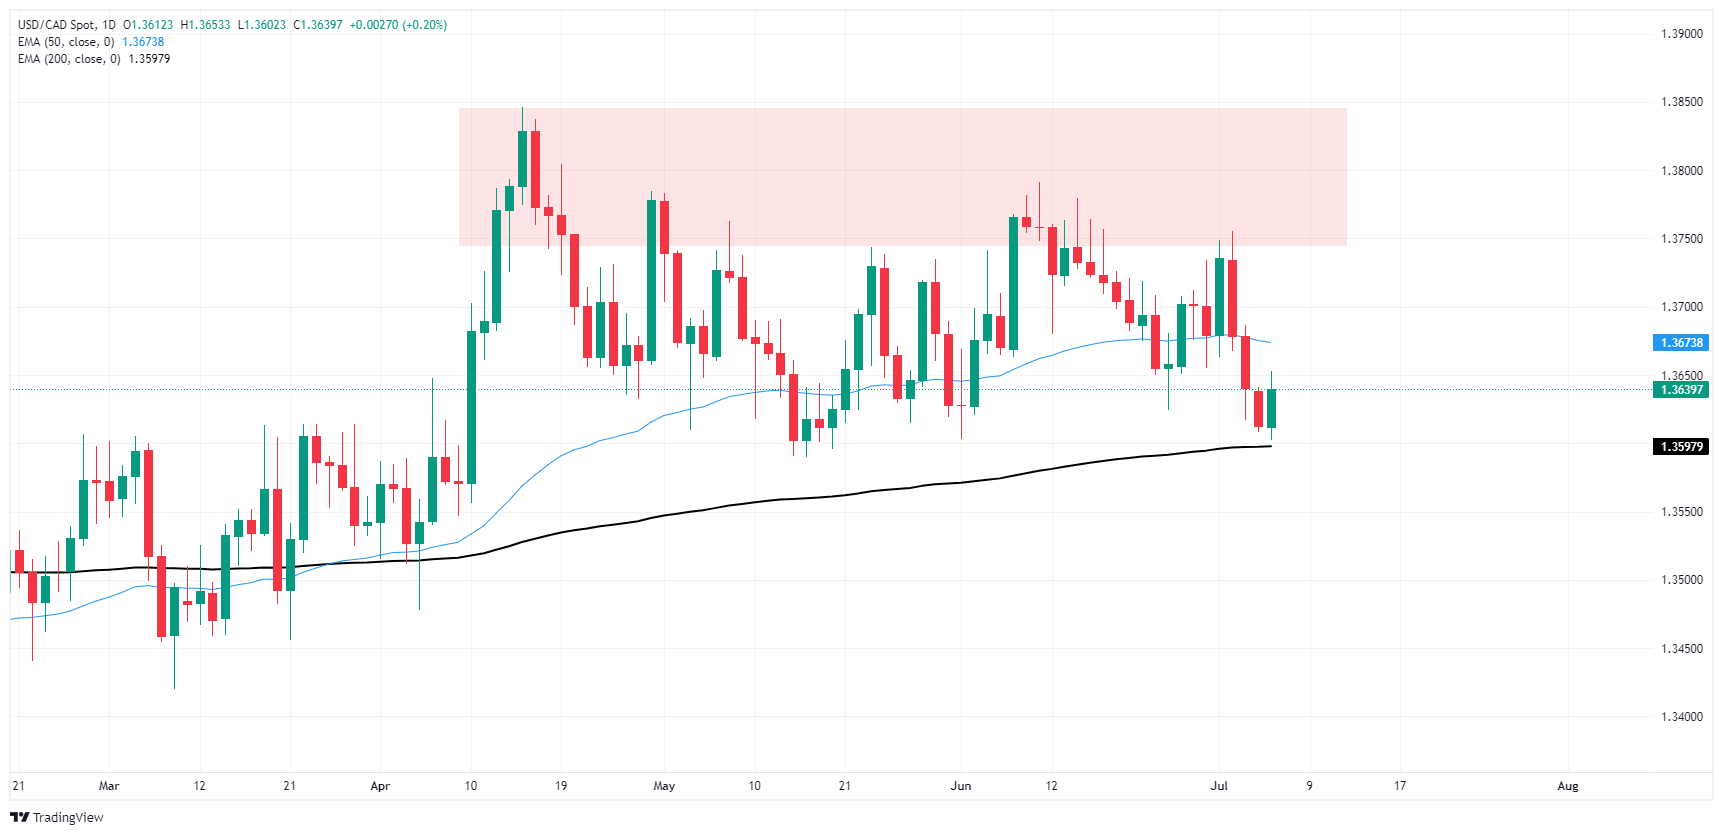
USD/CAD retested 1.3650, rising from a near-term floor just above the 1.3600 handle, and bidders will be looking for a fresh break north of the 200-hour Exponential Moving Average (EMA) at 1.3666. Daily candlesticks continue to hold onto chart territory above 1.3600 as a consolidation pattern continues to build into the charts, and price action is getting squeezed by a supply zone priced in above 1.3750 and a rising 200-day EMA at 1.3591.
USD/CAD hourly chart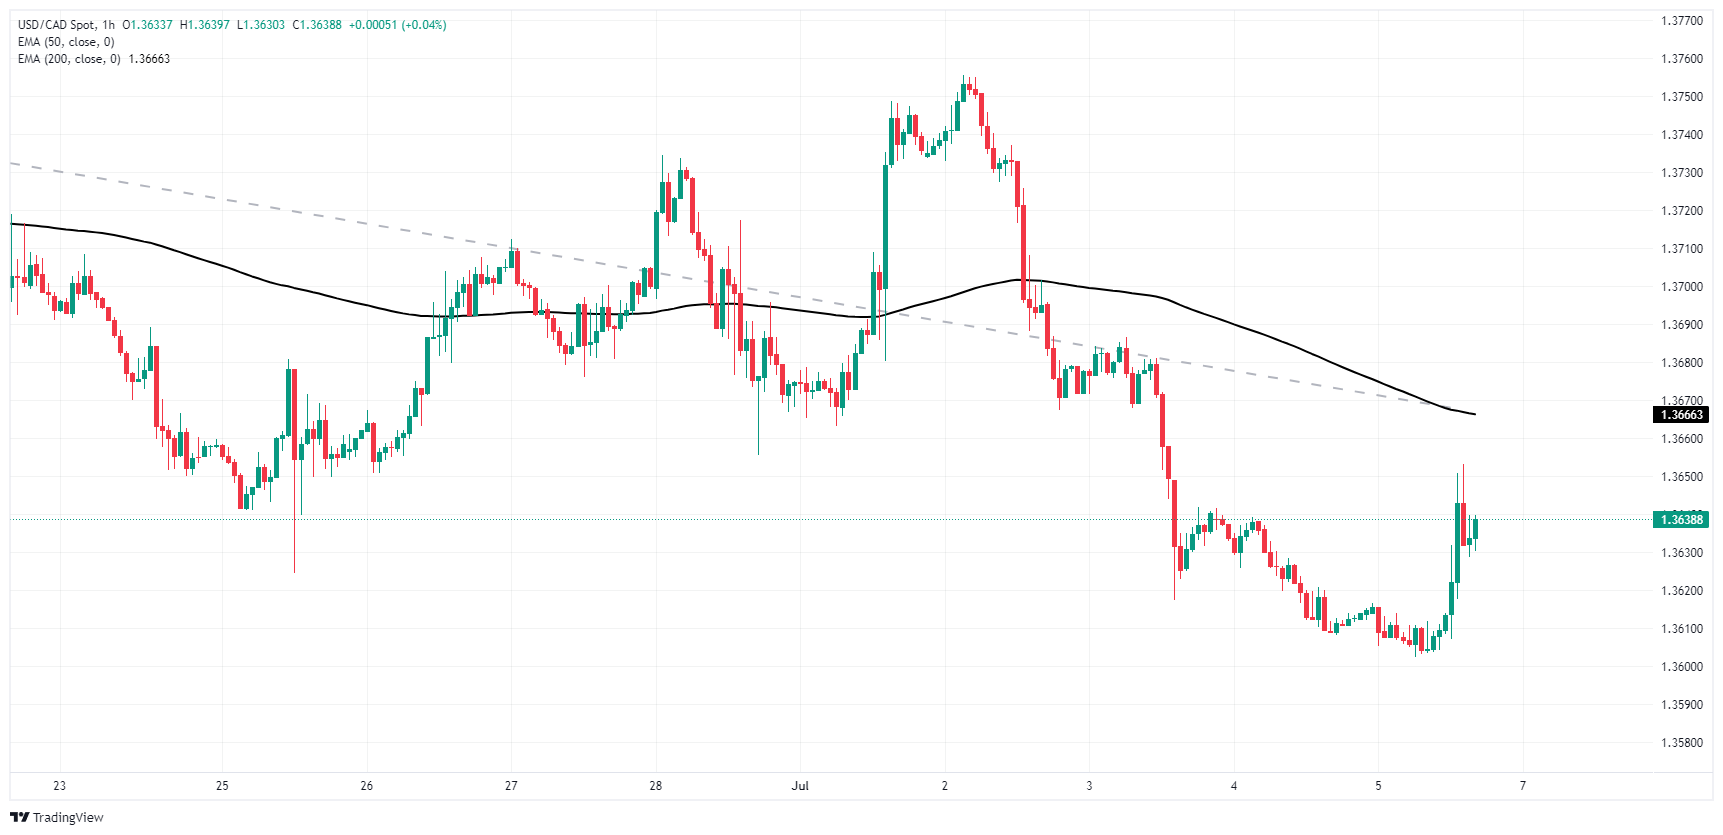
USD/CAD daily chart
Economic Indicator
Net Change in Employment
The Net Change in Employment released by Statistics Canada is a measure of the change in the number of people in employment in Canada. Generally speaking, a rise in this indicator has positive implications for consumer spending and indicates economic growth. Therefore, a high reading is seen as bullish for the Canadian Dollar (CAD), while a low reading is seen as bearish.
Last release: Fri Jul 05, 2024 12:30
Frequency: Monthly
Actual: -1.4K
Consensus: 22.5K
Previous: 26.7K
Source: Statistics Canada