- The Canadian Dollar is grappling with sideways momentum on Monday.
- Markets look ahead to key data for both the US and Canada in the latter half of the week.
- US PCE inflation & ISM Manufacturing, Canada GDP & employment change are on the horizon.
The Canadian Dollar (CAD) is middling against the US Dollar (USD) in early Monday trading, and markets are set for a calmer start to the week before high-impact figures for both the US and Canada begin to print in the back half of the trading week.
Loonie traders will be keeping an eye on Gross Domestic Product (GDP) growth figures from Canada on Thursday, with November’s Canadian Net Change in Employment slated for Friday.
On the USD side of the economic calendar, broader markets will see the FX space driven by US Core Personal Consumption Expenditures (PCE) price inflation on Thursday, as well as US ISM Manufacturing Purchasing Managers Index (PMI) figures on Friday.
Daily Digest Market Movers: Canadian Dollar treads water as markets take a breather before the mid-week data calendar gets underway
- Monday sees flat action on the Canadian Dollar side as investors await headlines or a change in underlying momentum.
- Loonie traders look ahead to Thursday’s Canadian GDP growth, markets expect a rebound to 0.2% annualized growth after the previous quarter’s -0.2% print.
- Canadian data releases to be overshadowed by US figures this week, the main focus will be US PCE inflation numbers for October, expected to show a slight decline in inflation price growth from 3.7% to 3.5% for the annualized period into October.
- US PCE inflation to print alongside Canadian GDP figures at 13:30 GMT on Thursday.
- Friday sees Canadian wages and labor figures alongside November’s US ISM Manufacturing PMI.
- The trading week will cap off with a late Friday appearance from Federal Reserve (Fed) Chairman Jerome Powell, due to participate in a “fireside chat” labeled “Navigating Pathways to Economic Mobility” at Atlanta’s Spelman College.
Canadian Dollar price today
The table below shows the percentage change of Canadian Dollar (CAD) against listed major currencies today. Canadian Dollar was the strongest against the Euro.
| USD | EUR | GBP | CAD | AUD | JPY | NZD | CHF | |
| USD | 0.04% | -0.07% | 0.07% | -0.21% | -0.43% | -0.15% | -0.11% | |
| EUR | -0.06% | -0.13% | 0.01% | -0.26% | -0.50% | -0.21% | -0.16% | |
| GBP | 0.07% | 0.13% | 0.14% | -0.13% | -0.36% | -0.08% | -0.04% | |
| CAD | -0.06% | -0.02% | -0.13% | -0.27% | -0.49% | -0.21% | -0.18% | |
| AUD | 0.20% | 0.27% | 0.13% | 0.27% | -0.23% | 0.05% | 0.11% | |
| JPY | 0.43% | 0.50% | 0.30% | 0.50% | 0.23% | 0.30% | 0.33% | |
| NZD | 0.17% | 0.21% | 0.08% | 0.23% | -0.05% | -0.28% | 0.05% | |
| CHF | 0.10% | 0.14% | 0.04% | 0.18% | -0.10% | -0.32% | -0.04% |
The heat map shows percentage changes of major currencies against each other. The base currency is picked from the left column, while the quote currency is picked from the top row. For example, if you pick the Euro from the left column and move along the horizontal line to the Japanese Yen, the percentage change displayed in the box will represent EUR (base)/JPY (quote).
Technical Analysis: Canadian Dollar grinds sideways as markets await a spark in the headlines
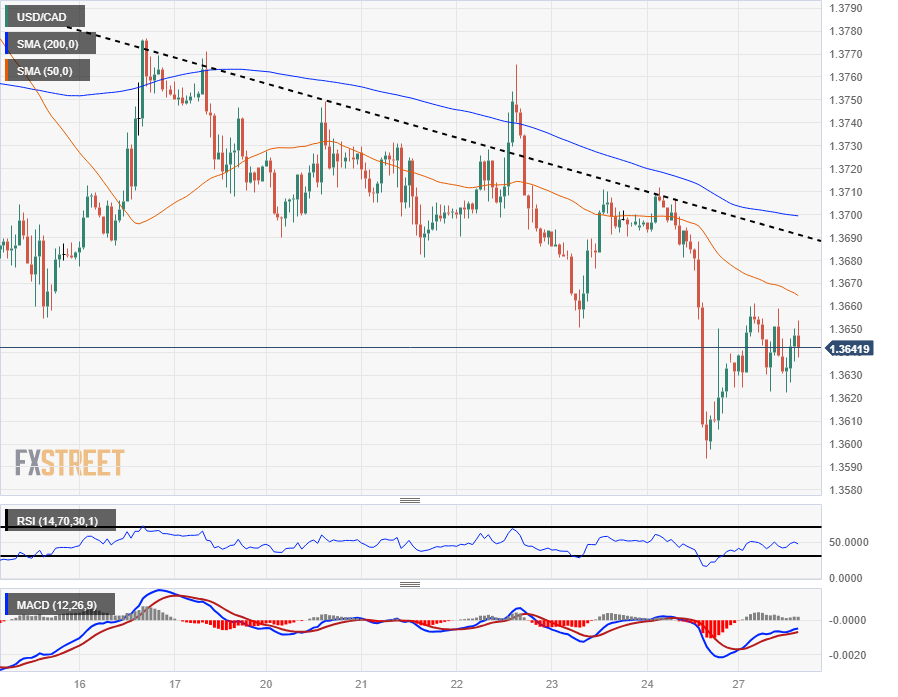
The Canadian Dollar (CAD) is caught in a tight range between 1.3660 and 1.3630 against the US Dollar (USD) for Monday’s trading window.
The USD/CAD is currently capped by the 50-hour Simple Moving Average (SMA) descending into 1.3665, with intraday support currently priced in at the day’s lows near 1.3620.
Near-term bullish momentum will see a technical ceiling at the 200-hour SMA drifting into the 1.3700 handle, and rallies could see bidders getting caught in a short squeeze, though a topside break of last Friday’s peak of 1.3712 will see a shift in the lower-highs pattern.
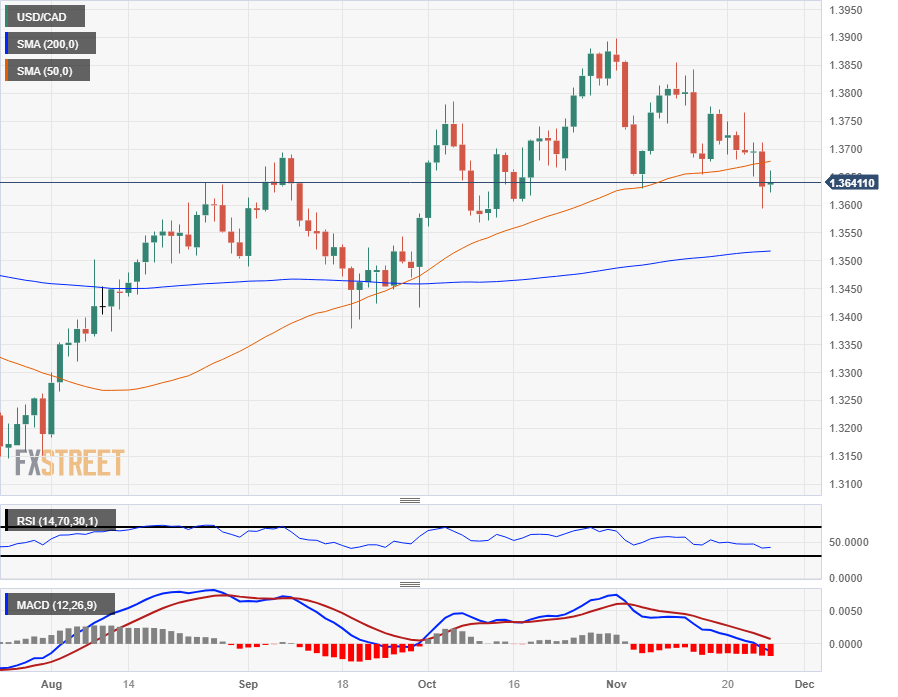
On the daily candlesticks, the USD/CAD remains trapped under the 50-day SMA, and the pair is drifting toward the median at the 200-day SMA, just north of the 1.3500 handle.
USD/CAD Hourly Chart
USD/CAD Daily Chart
Risk sentiment FAQs
In the world of financial jargon the two widely used terms “risk-on” and “risk off” refer to the level of risk that investors are willing to stomach during the period referenced. In a “risk-on” market, investors are optimistic about the future and more willing to buy risky assets. In a “risk-off” market investors start to ‘play it safe’ because they are worried about the future, and therefore buy less risky assets that are more certain of bringing a return, even if it is relatively modest.
Typically, during periods of “risk-on”, stock markets will rise, most commodities – except Gold – will also gain in value, since they benefit from a positive growth outlook. The currencies of nations that are heavy commodity exporters strengthen because of increased demand, and Cryptocurrencies rise. In a “risk-off” market, Bonds go up – especially major government Bonds – Gold shines, and safe-haven currencies such as the Japanese Yen, Swiss Franc and US Dollar all benefit.
The Australian Dollar (AUD), the Canadian Dollar (CAD), the New Zealand Dollar (NZD) and minor FX like the Ruble (RUB) and the South African Rand (ZAR), all tend to rise in markets that are “risk-on”. This is because the economies of these currencies are heavily reliant on commodity exports for growth, and commodities tend to rise in price during risk-on periods. This is because investors foresee greater demand for raw materials in the future due to heightened economic activity.
The major currencies that tend to rise during periods of “risk-off” are the US Dollar (USD), the Japanese Yen (JPY) and the Swiss Franc (CHF). The US Dollar, because it is the world’s reserve currency, and because in times of crisis investors buy US government debt, which is seen as safe because the largest economy in the world is unlikely to default. The Yen, from increased demand for Japanese government bonds, because a high proportion are held by domestic investors who are unlikely to dump them – even in a crisis. The Swiss Franc, because strict Swiss banking laws offer investors enhanced capital protection.