- Canadian Dollar (USD) sees slight gains against US Dollar following US PPI miss.
- Canada economic calendar empty of meaningful data until next Tuesday’s CPI.
- Crude Oil up again on supply chain fears.
The Canadian Dollar is a mixed bag in Friday trading, seeing moderate gains against the US Dollar (USD) after a downside print in the US Producer Price Index forced the Greenback lower across the board. With a mixed performance on the day for the CAD, the Loonie is in the red against most of its major currency peers for the week, save for a slight uptick against the USD from Monday’s opening bids.
Loonie traders will have to wait until next Tuesday for the next print of Canada’s Consumer Price Index (CPI) inflation. However, Monday sees low-impact Manufacturing Sales from November as well as the Bank of Canada’s (BoC) latest Business Outlook Survey.
Crude Oil markets remain tense about Middle East conflicts potentially impacting the global barrel trade. As the ongoing spat with Houthi rebels continues, more firms continue to divert tankers and cargo ships from the Red Sea and the Suez Canal in order to take a longer trip around the continent of Africa.
Daily digest market movers: Canadian Dollar gets a slight leg up on lower than expected US PPI
- The Canadian Dollar is up a tenth of a percent against the Greenback on Friday as the US Dollar gets sold off amidst markets increasing their rate-cut bets from the Federal Reserve (Fed).
- US PPI figures missed the mark on Friday.
- December’s US PPI declined by 0.1% versus the forecasted 0.1% increase, adding to November’s print which saw a downside revision from 0.0% to -0.1% as well.
- US Core annualized PPI through December came in at 1.8%, down from the previous period’s and below the median market forecast of 1.9%.
- With inflation easing back faster than expected at the producer level, markets are once again ramping up bets of a faster, deeper pace of rate cuts from the Fed.
- Fed swaps are pricing in additional monetary easing through 2024, with short-term interest-rate futures on the rise and markets betting on 160 basis points of cuts from the Fed for the year, up from 154 bps.
- Crude Oil market tensions over Middle East turmoil are on the rise once again as US and UK naval forces launch strikes against Houthi targets, a move that is sure to draw ire from Iran, which openly backs Houthi activities in and around Yemen.
Canadian Dollar price today
The table below shows the percentage change of Canadian Dollar (CAD) against listed major currencies today. Canadian Dollar was the strongest against the Pound Sterling.
| USD | EUR | GBP | CAD | AUD | JPY | NZD | CHF | |
| USD | 0.28% | 0.31% | 0.22% | 0.21% | -0.10% | -0.02% | 0.26% | |
| EUR | -0.28% | 0.03% | -0.07% | -0.09% | -0.37% | -0.32% | -0.02% | |
| GBP | -0.30% | -0.03% | -0.09% | -0.11% | -0.40% | -0.35% | -0.03% | |
| CAD | -0.22% | 0.05% | 0.09% | -0.04% | -0.32% | -0.24% | 0.04% | |
| AUD | -0.21% | 0.08% | 0.11% | 0.03% | -0.30% | -0.24% | 0.08% | |
| JPY | 0.13% | 0.38% | 0.42% | 0.32% | 0.33% | 0.07% | 0.39% | |
| NZD | 0.02% | 0.32% | 0.35% | 0.25% | 0.24% | -0.06% | 0.34% | |
| CHF | -0.27% | 0.01% | 0.04% | -0.05% | -0.06% | -0.37% | -0.29% |
The heat map shows percentage changes of major currencies against each other. The base currency is picked from the left column, while the quote currency is picked from the top row. For example, if you pick the Euro from the left column and move along the horizontal line to the Japanese Yen, the percentage change displayed in the box will represent EUR (base)/JPY (quote).
Technical Analysis: Canadian Dollar finds a slight foothold against US Dollar on Friday
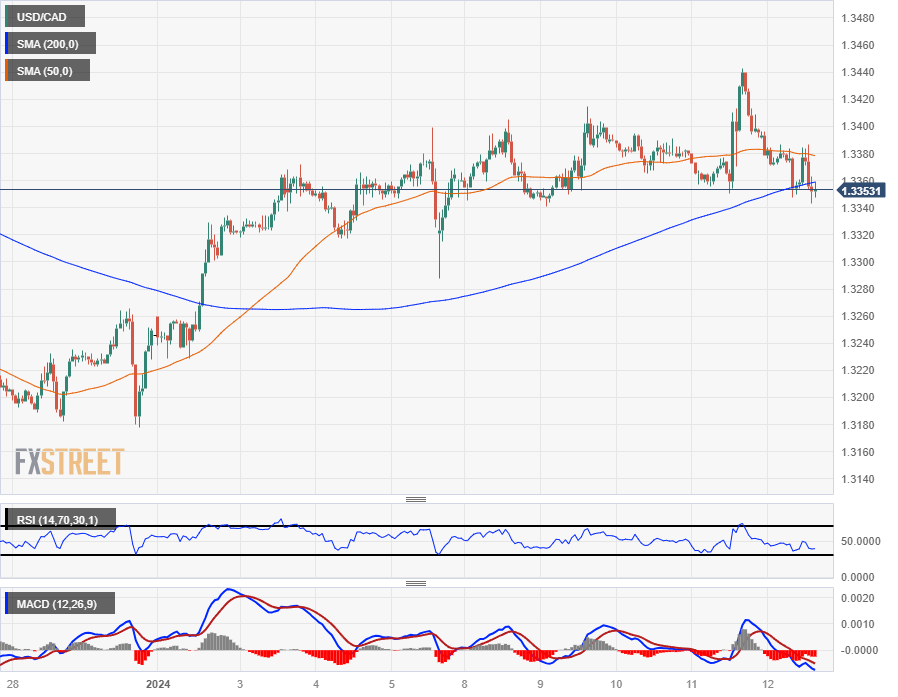
The Canadian Dollar (CAD) is slightly up against the Greenback heading into the end of the trading week, pushing the USD/CAD pair down into the 1.3350 neighborhood.
The pair rose to a new 2024 high of 1.3443 on Thursday, but price action is drifting back into the midrange with intraday chart action knocking against the 200-hour Simple Moving Average (SMA) near 1.3360. A near-term pattern of higher lows is set to break down as the USD/CAD drifts sideways heading into next week.
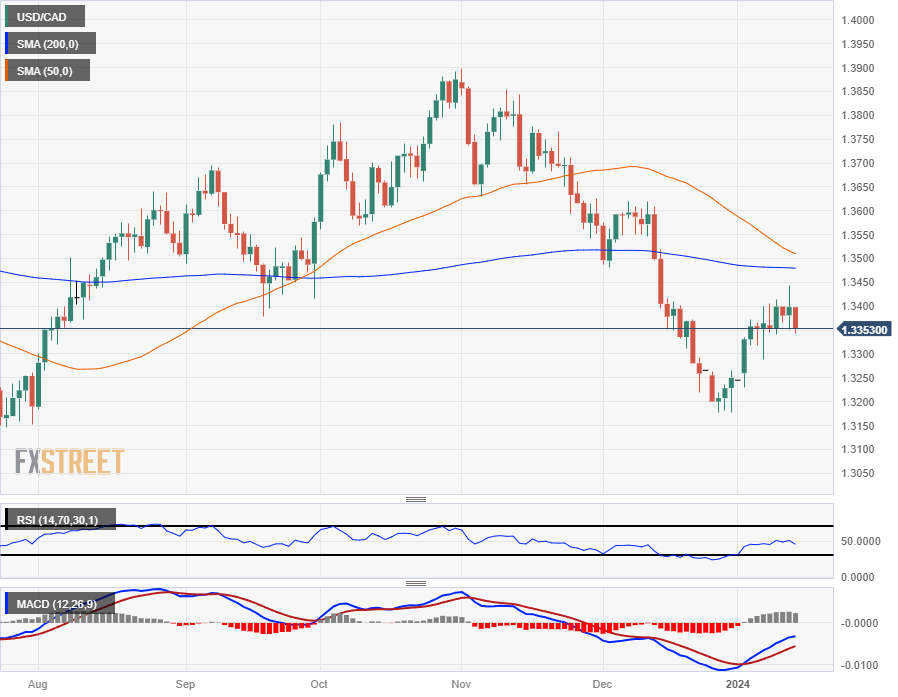
Daily candlesticks have the USD/CAD continuing to trade on the low side of the 200-day SMA near 1.3500, and a descending 50-day SMA is set for a bearish crossover of the longer moving average, which could form a technical ceiling for the pair moving forward. The pair is currently up 0.73% from 2024’s opening bids and has climbed 1.26% from December’s late low of 1.3775.
USD/CAD Hourly Chart
USD/CAD Daily Chart
Inflation FAQs
Inflation measures the rise in the price of a representative basket of goods and services. Headline inflation is usually expressed as a percentage change on a month-on-month (MoM) and year-on-year (YoY) basis. Core inflation excludes more volatile elements such as food and fuel which can fluctuate because of geopolitical and seasonal factors. Core inflation is the figure economists focus on and is the level targeted by central banks, which are mandated to keep inflation at a manageable level, usually around 2%.
The Consumer Price Index (CPI) measures the change in prices of a basket of goods and services over a period of time. It is usually expressed as a percentage change on a month-on-month (MoM) and year-on-year (YoY) basis. Core CPI is the figure targeted by central banks as it excludes volatile food and fuel inputs. When Core CPI rises above 2% it usually results in higher interest rates and vice versa when it falls below 2%. Since higher interest rates are positive for a currency, higher inflation usually results in a stronger currency. The opposite is true when inflation falls.
Although it may seem counter-intuitive, high inflation in a country pushes up the value of its currency and vice versa for lower inflation. This is because the central bank will normally raise interest rates to combat the higher inflation, which attract more global capital inflows from investors looking for a lucrative place to park their money.
Formerly, Gold was the asset investors turned to in times of high inflation because it preserved its value, and whilst investors will often still buy Gold for its safe-haven properties in times of extreme market turmoil, this is not the case most of the time. This is because when inflation is high, central banks will put up interest rates to combat it.
Higher interest rates are negative for Gold because they increase the opportunity-cost of holding Gold vis-a-vis an interest-bearing asset or placing the money in a cash deposit account. On the flipside, lower inflation tends to be positive for Gold as it brings interest rates down, making the bright metal a more viable investment alternative.