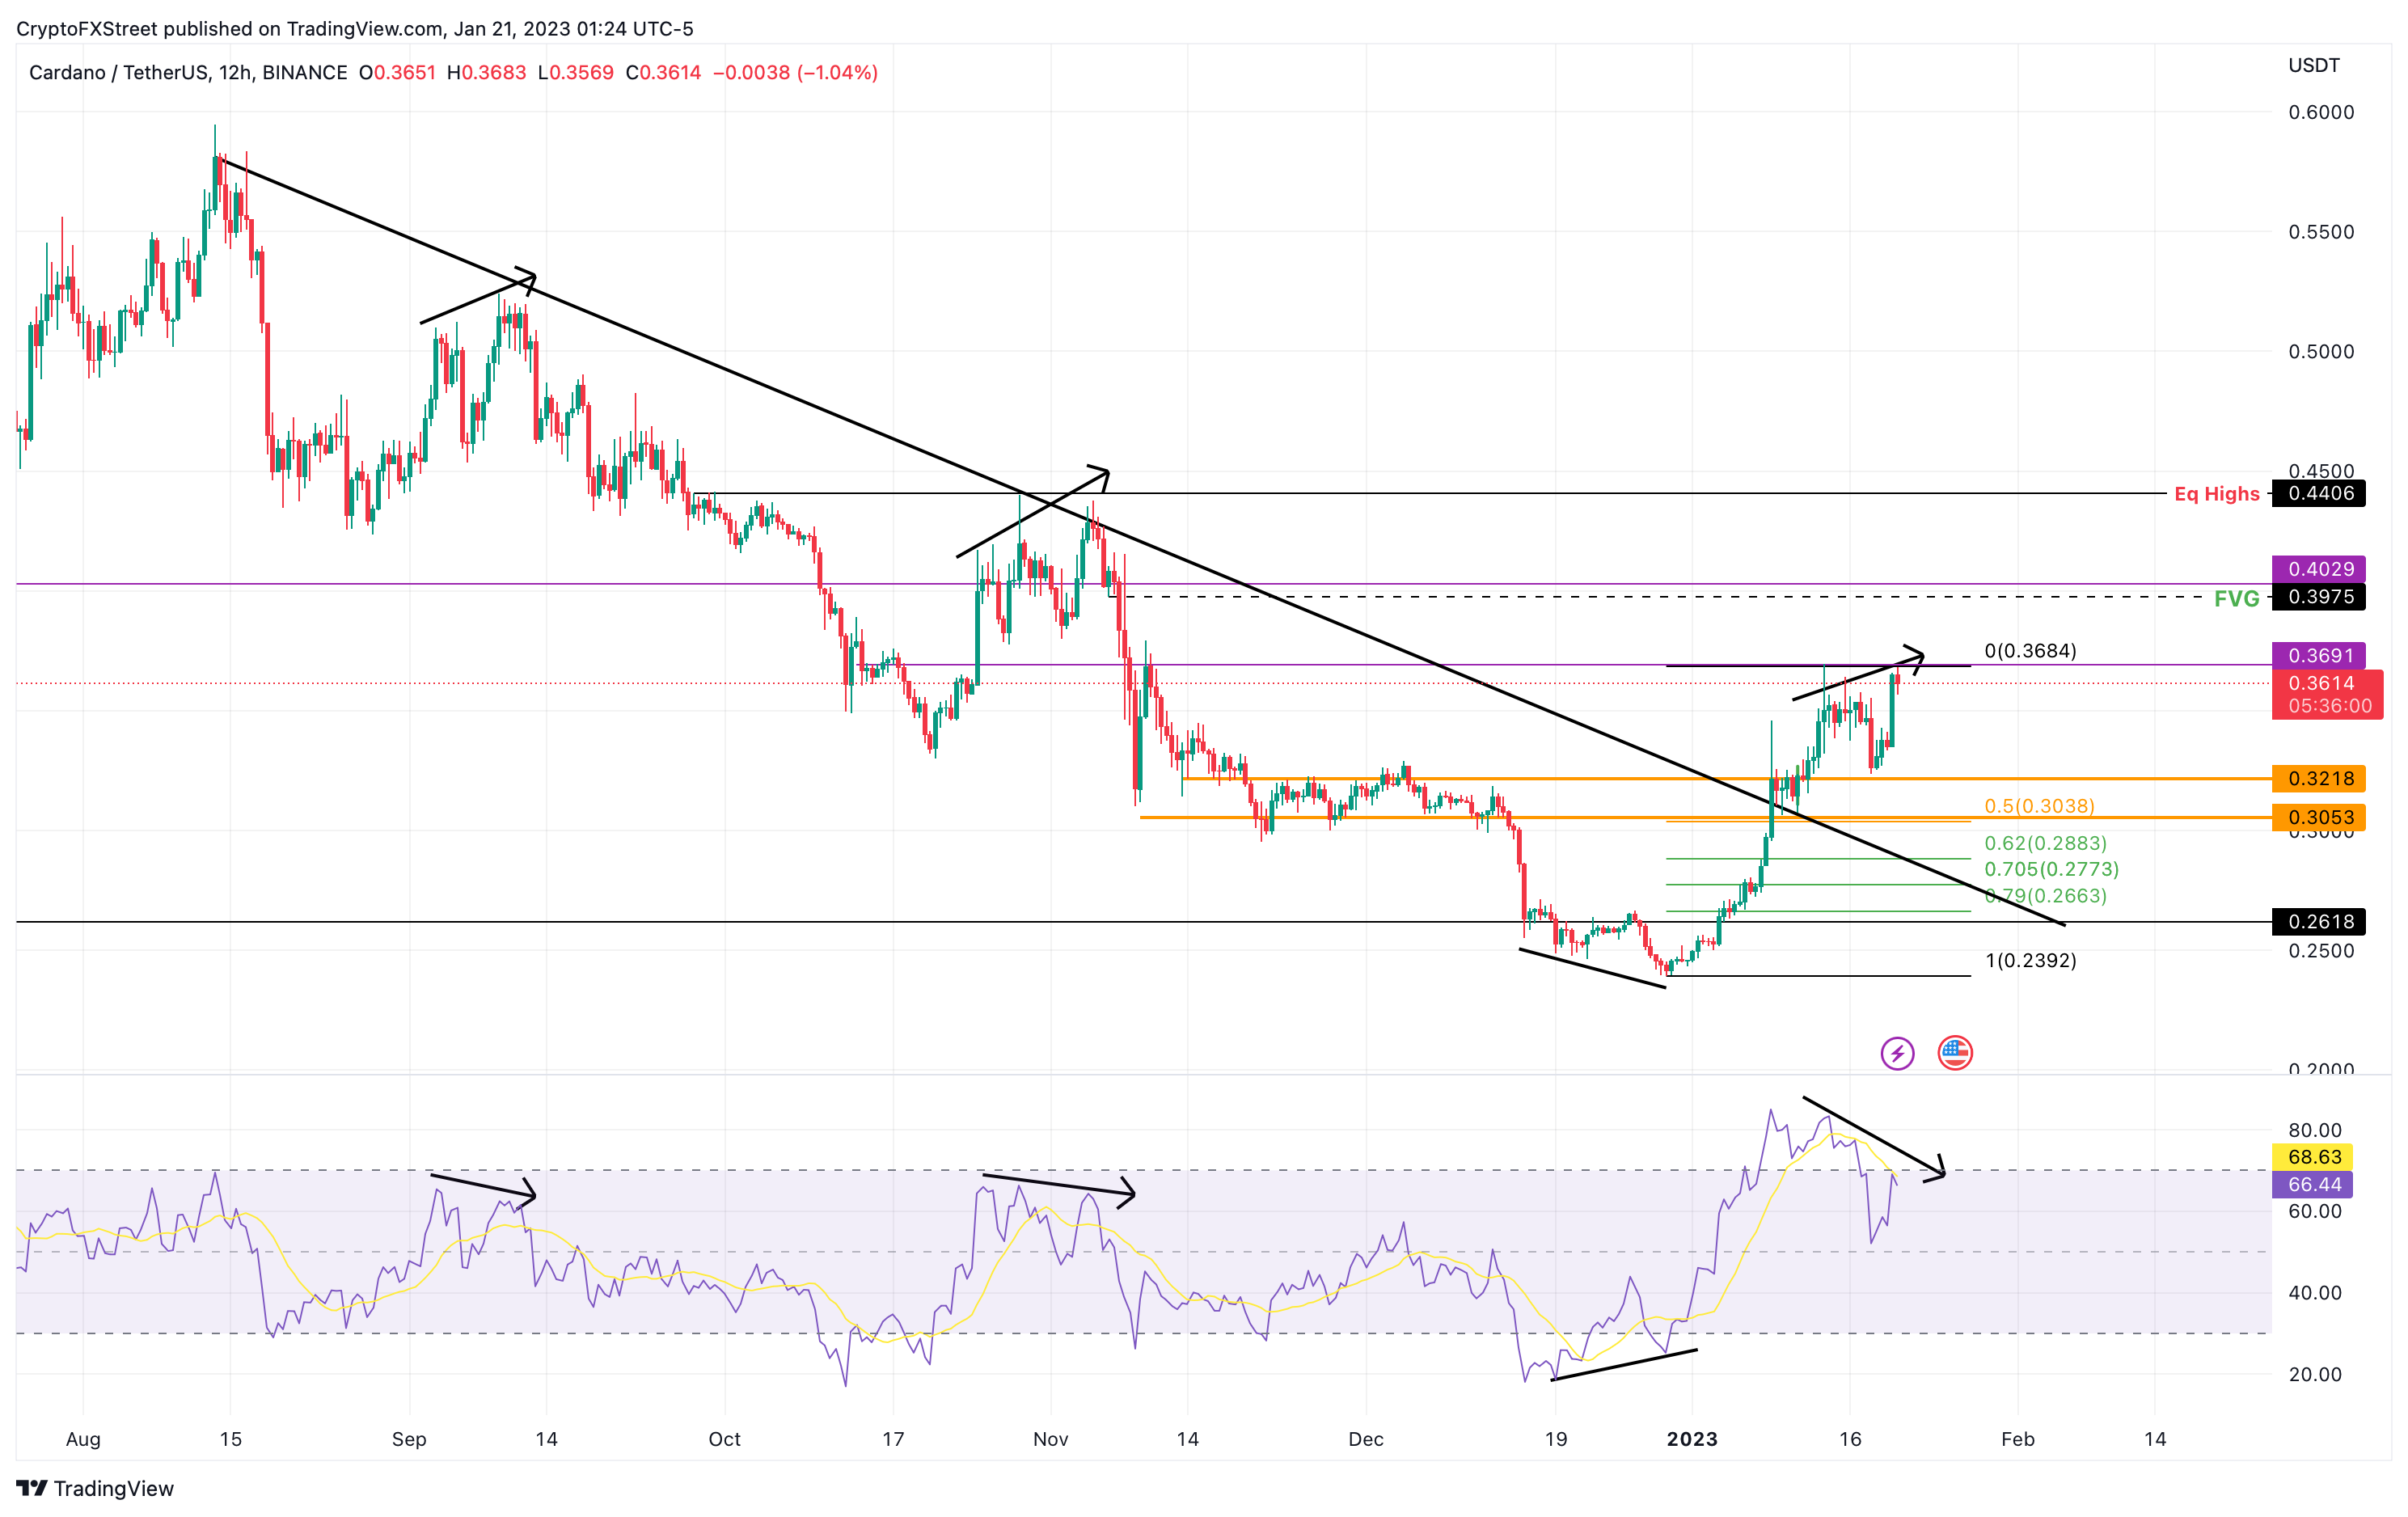
- Cardano price is having trouble overcoming the $0.369 hurdle while the RSI continues to tank.
- ADA could slide 15% to retest the $0.303 support level.
- A flip of the $0.369 resistance level into a support floor with the backing of rising momentum will invalidate the bearish outlook.
Cardano price shows an ongoing struggle at a hurdle that has previously served as a stable support. A failure to move past this blockade without the blessings of bulls will be short-lived and could result in a reversal of the trend.
Cardano price at wits’ end
Cardano price inflated by 54% in the last three weeks and has retested the $0.369 hurdle twice. As a result, ADA has produced equal highs at this barrier, which could lead to two things.
- A double top formation that results in a trend reversal and a 15% downswing that retests $0.303.
- Or a minor run-up to collect the buy-stop liquidity above $0.369, followed by a retracement to $0.303.
Both outlooks are plausible since the RSI is showing signs of waning momentum. Looking at the price action of ADA for the last few months shows that every local top has been a result of declining momentum.
Therefore, investors need to pay close attention to Cardano price, which shows a similar setup. Beyond $0.303, the 62% and 70.5% retracement levels at $0.288 and $0.277, respectively, are good places for buyers to make a comeback.

ADA/USDT 12-hour chart
On the other hand, if bears fail to make their presence known, Cardano price could bounce around $0.321 and allow the RSI to reset around the midpoint at 50. In such a case, if ADA produces a twelve-hour candlestick close above $0.369 that flips it into a support floor will invalidate the bearish thesis.
Such a development could see Cardano price revisit the $0.403 and $0.441 hurdles.