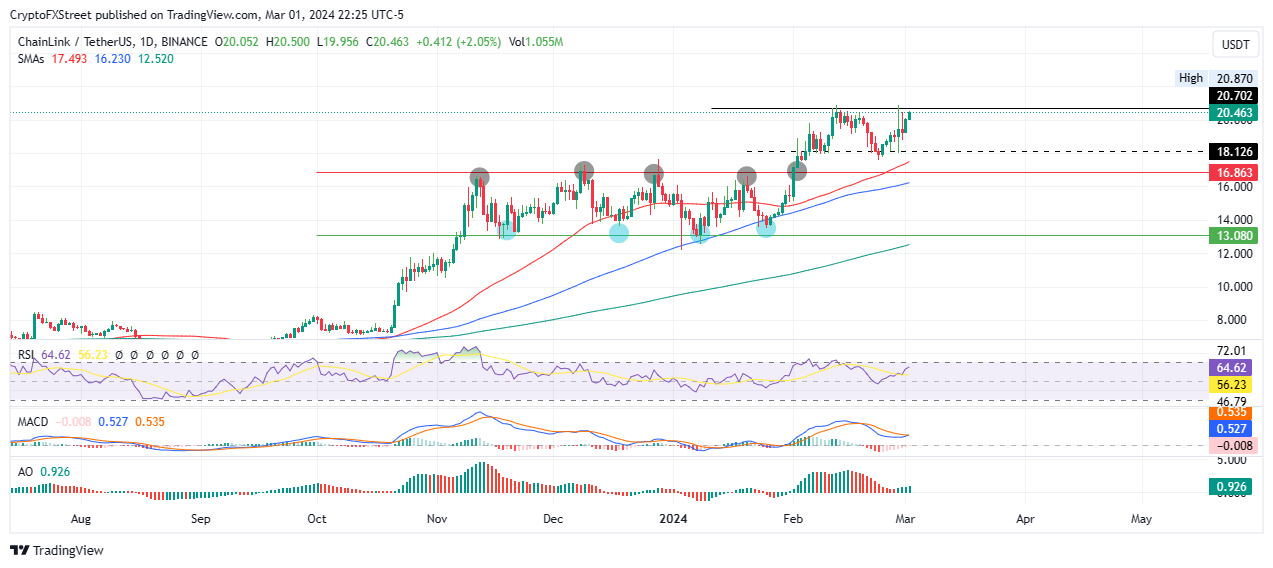
- Chainlink price has taken its wave-like motion the next step, having established another range higher.
- LINK could drop 10% before another leg up, providing entry for traders looking to buy the dip.
- A break and close below $18.86 would produce a lower low, initiating a possible trend change.
Chainlink (LINK) price is trading with a bullish bias, recording higher highs and higher lows since October when cryptocurrency markets turned bullish. The altcoin has provided one of the easiest trades since November, with a defined and predictable wave-like motion within a range. If history rhymes, LINK traders could have another chance to buy LINK at discounted rates.
Also Read: Chainlink’s large wallet holders pull $216 million worth of LINK out of exchanges, fuel gains
Chainlink price eyes 10% fall before next leg up
Chainlink (LINK) price is confronting resistance at $20.70 for the second time in February. The altcoin could suffer a rejection, potentially falling 10% to $18.12, and giving another buy opportunity around this level before the next leg up.
Notice the position of the Relative Strength Index (RSI), around the level where it has pulled south multiple times in the past. The Moving Average Convergence Divergence (MACD) indicator also has a bearish crossover in the line, pending execution once the orange band of the signal line crosses below the MACD, expected to provoke a trend reversal to the south.
Buy orders are likely accumulated around the $18.12, the 50-day Simple Moving Average (SMA) at $17.49, or for the overly confident traders, the $16.86 support level, which is a critical area marking the peak of the previous range-bound move.
On the flip side, if buying pressure increases, Chainlink price could extrapolate the gains. A break and close above the $20.87 range high would violate the pattern. To the south side, a break and close below $16.86 range bottom would produce a lower low, flipping the trend in favor of the downside.
Source
