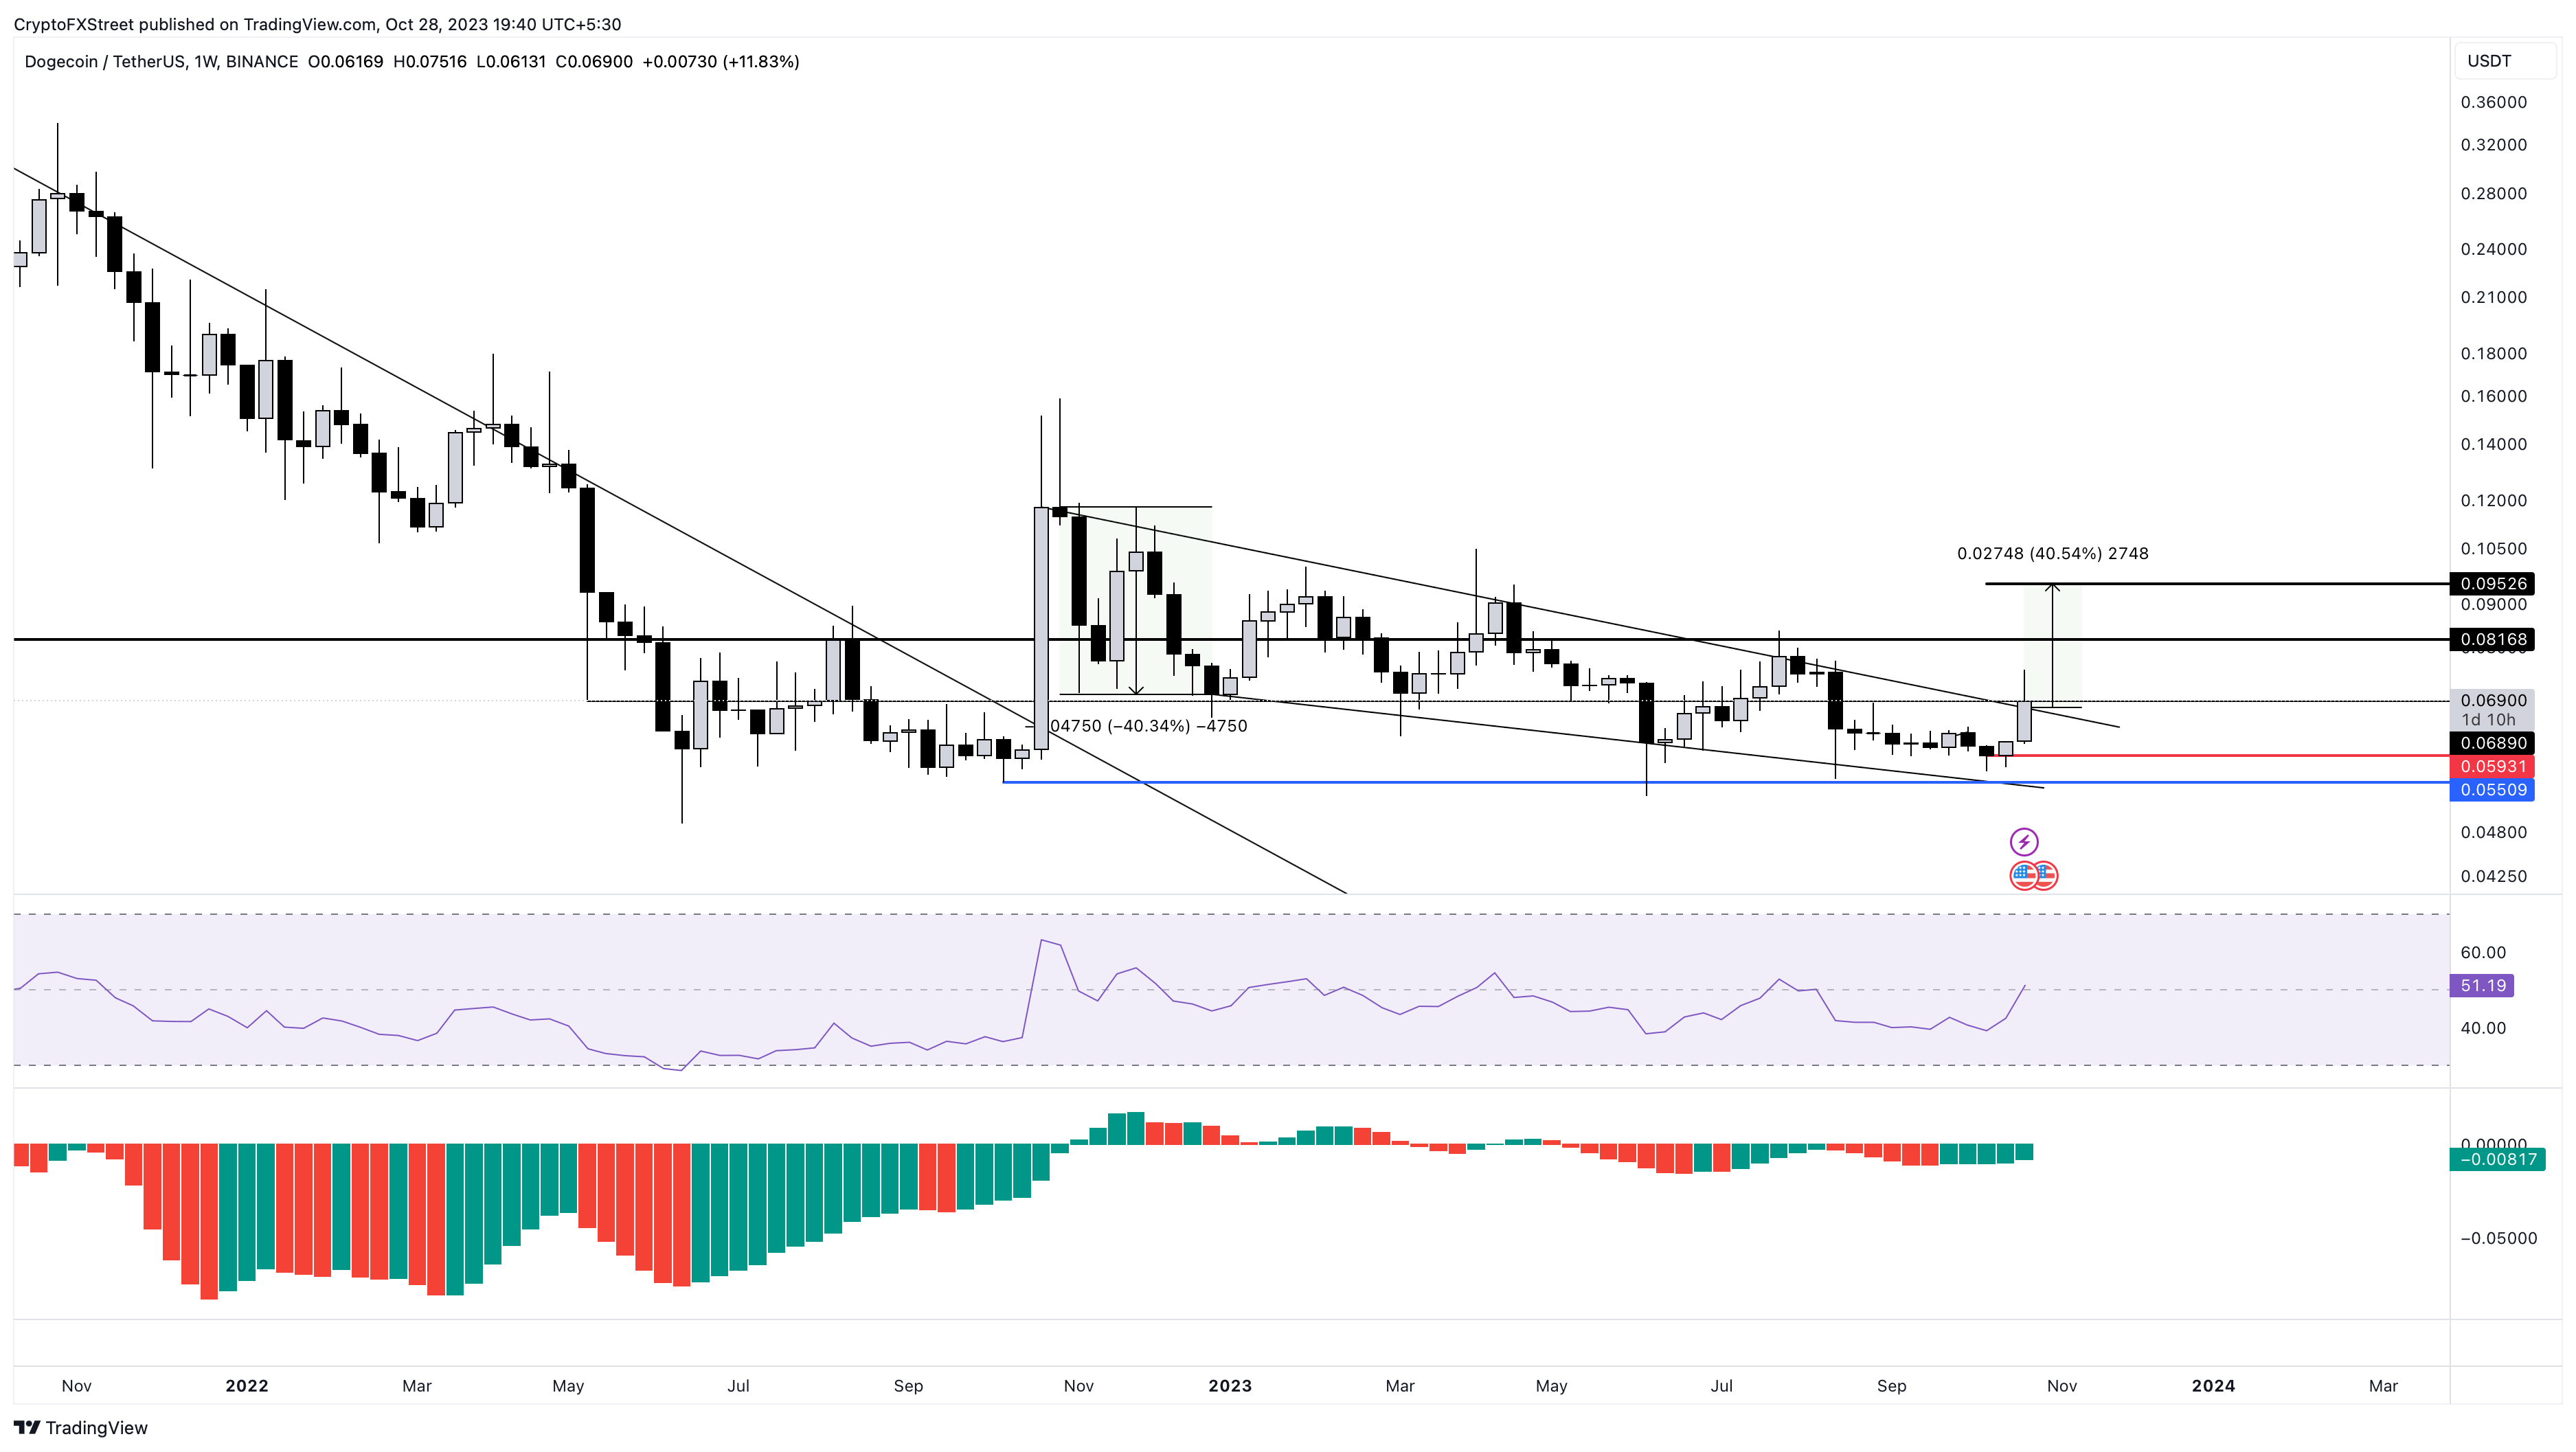
- Dogecoin price has set up a falling wedge pattern on the weekly time frame.
- A breakout from this technical formation forecasts a 40% rally to $0.0952.
- A weekly candlestick close below the $0.0593 support level will invalidate the bullish thesis for DOGE.
Dogecoin (DOGE) price coils up inside a falling wedge pattern and is close to breaking out. A successful move out of this setup could trigger a volatile move to the upside for DOGE holders. But a move back into the wedge formation could put breakout traders in a tough spot.
Also read: Dogecoin aims for July highs with potential 10% gain amid meme coin revival
Dogecoin price close to breakout
Dogecoin (DOGE) price coils up inside a falling wedge pattern, forecasting an explosive move on the successful breakout. Since October 31, DOGE has set up four lower highs and four lower lows, which, when connected via trend lines, reveal a falling wedge.
This technical formation forecasts a 40% upswing to $0.0952, which is obtained by measuring the distance between the first swing high and swing low to the potential breakout point of $0.0688.
The Relative Strength Index (RSI), which hovers just above 50, is at a make-or-break point. A higher push in Dogecoin price will allow DOGE to flip the mean level, adding a tailwind to the partially bullish outlook.
In such a case, Dogecoin price could rally 18% and tag the $0.0816 resistance level. Beyond this barrier, DOGE might extend the climb to retest the theoretical target of $0.0952. This move would constitute a 40%.
Read more: Bitcoin hitting $31,000 might cost Dogecoin price its potential nine-week rally
DOGE/USDT 4-hour chart
Regardless of the optimism, if Dogecoin price produces a weekly candlestick close below the $0.0593 support level, it will create a lower low and invalidate the bullish thesis for DOGE. This move could further trigger a 7% crash to October 10 swing low of $0.0550.
Read more: Dogecoin Price Forecast: DOGE breakout could kickstart 10% rally
Source
