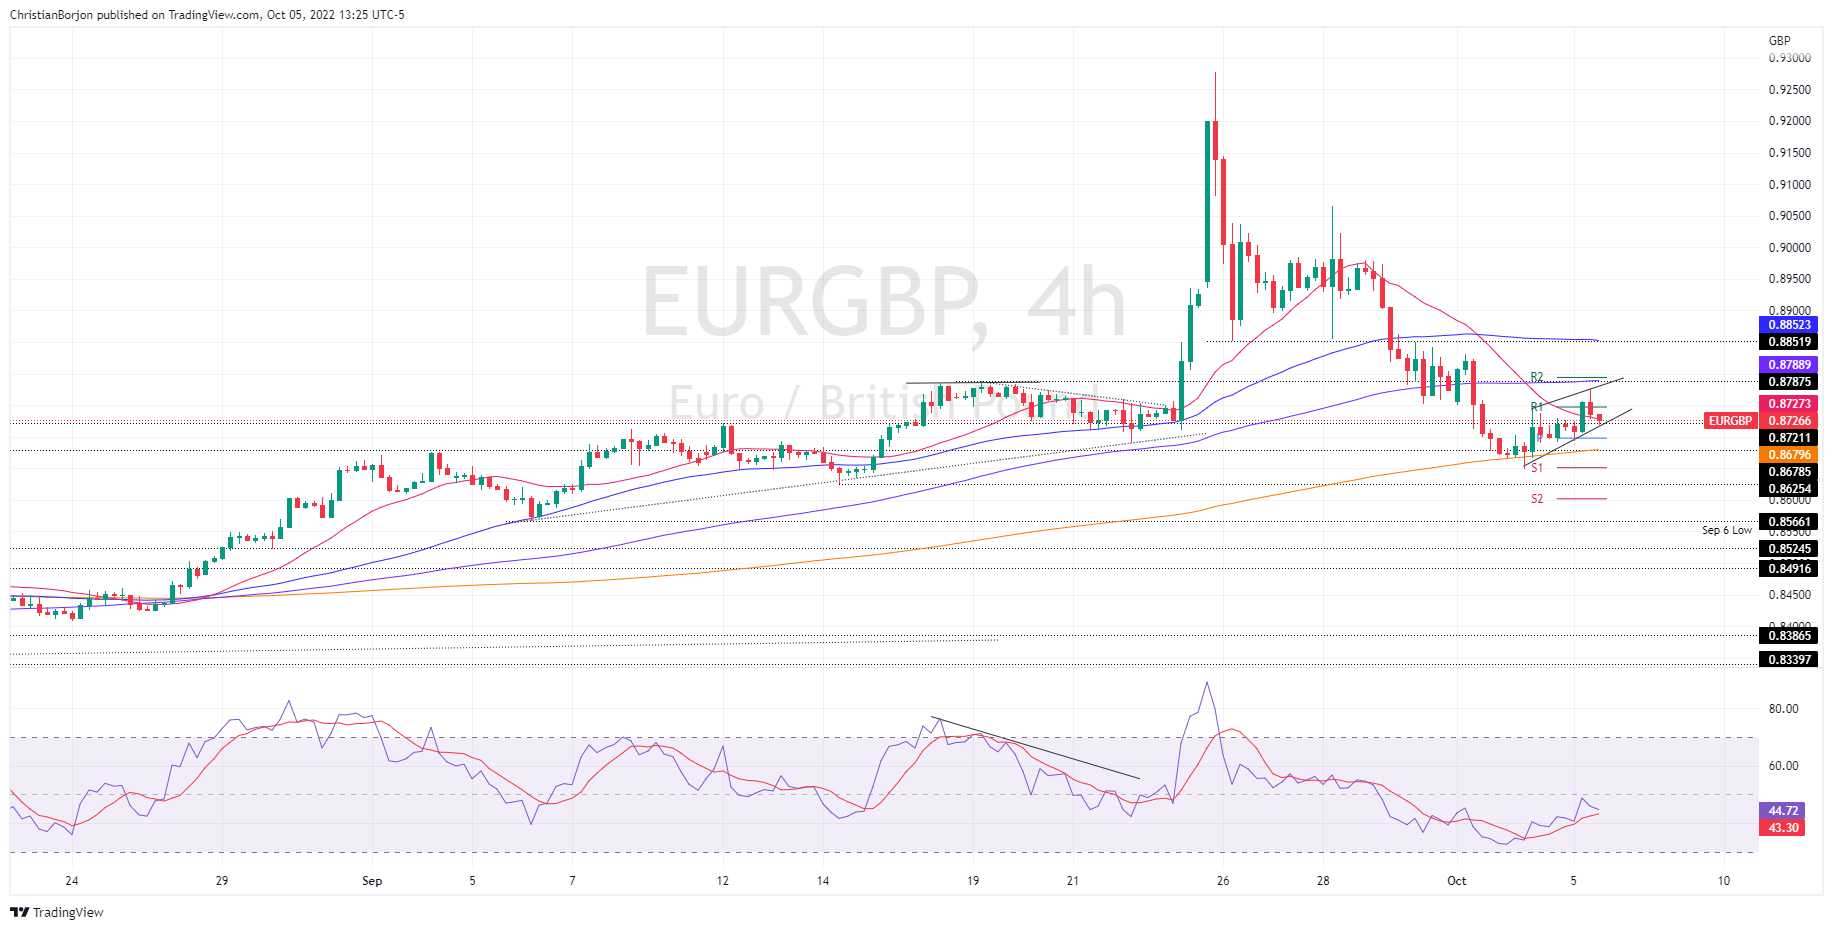
- EUR/GBP drops below the 20-day as buyers’ momentum abate.
- The Relative Strength Index (RSI) pierced the 50-midline but is almost flat.
- The EUR/GBP 4-hour chart portrays a rising-wedge formed, targeting a fall towards 0.8600.
The EUR/GBP bounces off Tuesday’s close price and is edging higher, though solid resistance at around the 20-day EMA at 0.8768 put a lid on the cross-currency uptrend, retreating just below Tuesday’s high. However, the EUR/GBP remains positive, trading at 0.8726, above its opening price by 0.31%.
EUR/GBP Price Analysis: Technical outlook
During the last seven days, the pair’s volatility increased after the UK’s tax cut budget. Nevertheless, once the government backpedaled, the EUR/GBP tumbled from around 0.9277 to 0.8647 before recovering some ground. Given that the cross-currency pair dropped below the 20-day EMA and has been unable to crack it, the EUR/GBP is neutral bias. Additionally, the Relative Strength Index (RSI) entered the bearish territory but so far recovered and pierced the 50 mid-line. Nevertheless, price action’s failure to hold to gains above the 20-day EMA shows buyers might be losing momentum.
Short term, the EUR/GBP 4-hour chart depicts a rising-wedge formation, opening the door for further losses. If the EUR/GBP breaks below the bottom-trendline of the wedge, it could pave the way for further losses.
Therefore, the EUR/GBP first support would be the daily pivot at 0.8699. Once cleared, the next support would be the 200-EMA at 0.8679, followed by the S1 daily pivot at 0.8650, followed by the S2 daily pivot at 0.8600.
