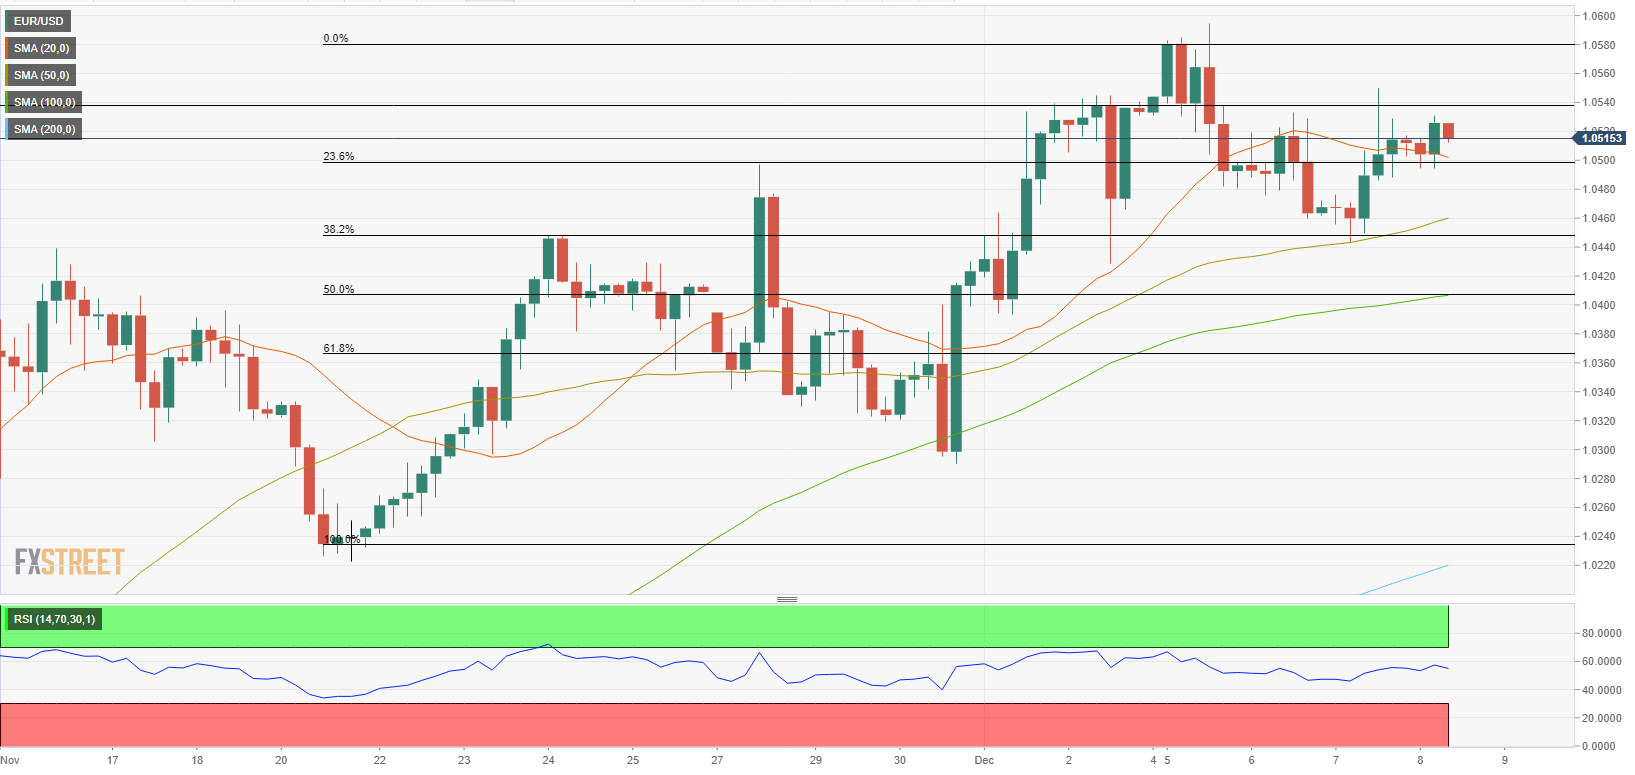
- EUR/USD has stabilized above 1.0500 after having snapped a two-day losing streak.
- Technical picture points to a bullish tilt in the short-term outlook.
- The pair could gain traction in case risk flows return.
EUR/USD seems to have stabilized above 1.0500 early Thursday after having managed to close in the positive territory for the first time this week on Wednesday. The technical outlook suggests that buyers could retain control in the short term as long as the pair continues to trade above 1.0500.
The renewed US Dollar weakness amid falling US Treasury bond yields helped EUR/USD edge higher in the second half of the day on Wednesday. Amid growing concerns over the US economy tipping into recession next year, the benchmark 10-year US Treasury bond yield dropped to its lowest level since mid-September at 3.4%.
During the European trading hours, the 10-year US T-bond yield is recovering toward 3.5% and helping the US Dollar limit its losses for the time being. Meanwhile, US stock index futures trade modestly higher on the day.
The US Department of Labor’s weekly Initial Jobless Claims data will be featured in the US economic docket but market participants are unlikely to react to this report. Hence, the risk perception could impact EUR/USD’s action in the second half of the day.
In case Wall Street’s main indexes start pushing higher after the opening bell, the US Dollar is likely to have a hard time finding demand and help EUR/USD push higher. A negative shift in risk mood could have the opposite impact on the pair.
European Central Bank (ECB) President Christine Lagarde is scheduled to deliver her pre-recorded opening remarks at a virtual conference hosted by the European Systemic Risk Board at 1200 GMT. Since the ECB is in the quiet period ahead of next week’s policy meeting, Lagarde is likely to refrain from commenting on the policy outlook.
EUR/USD Technical Analysis
EUR/USD climbed above 1.0500, where the Fibonacci 23.6% retracement of the latest uptrend and the 20-period Simple Moving Average (SMA) on the four-hour chart is located. Additionally, the Relative Strength Index rose slightly above 50, pointing to a bullish tilt in the short-term outlook.
1.0540 (static level) aligns as interim resistance ahead of 1.0580 (end-point of the uptrend) and 1.0600 (psychological level).
On the downside, a four-hour close below 1.0500 could be seen as a bearish development and open the door for an extended slide toward the 1.0460/1.0450 area (50-period SMA, Fibonacci 38.2% retracement) and 1.0430 (Fibonacci 50% retracement, 100-period SMA).
