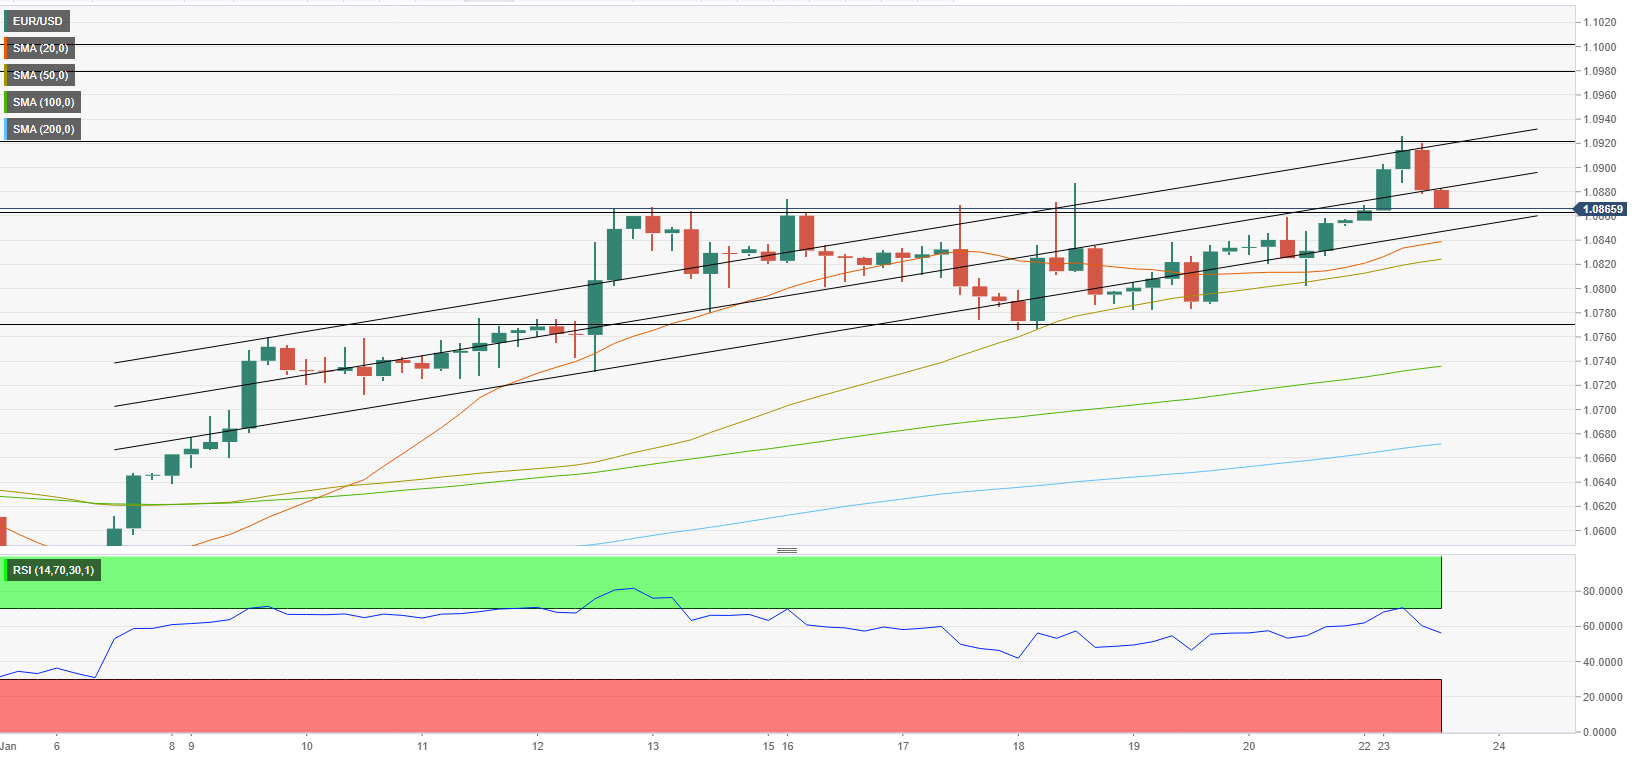
- EUR/USD has turned south and declined below 1.0900.
- The pair is likely to find support at 1.0840.
- Mixed comments from ECB officials seem to be limiting the Euro’s upside for the time being.
EUR/USD has lost its traction and declined below 1.0900 after having reached its highest level since April above 1.0900 earlier in the day. The pair’s near-term technical outlook suggests that the pair’s recent pullback is a technical correction rather than a reversal of direction.
The US Dollar started the new week under selling pressure and helped EUR/USD build on last week’s gains during the Asian trading hours. With the benchmark 10-year US Treasury bond yield rising to the 3.5% area, however, the US Dollar managed to find demand and didn’t allow the pair to preserve its bullish momentum. ,
On the other hand, mixed comments from European Central Bank (ECB) officials seem to have caused the Euro to lose some interest. ECB policymaker Peter Kazimir said on Monday that he is convinced that they need to deliver two more 50 basis points rate hikes. On a dovish note, “the adjustment of interest rates needs to be more gradual, taking into account the slowdown in growth of the euro area economy,” Governing Council member Yannis Stournaras argued.
Meanwhile, US stock index futures edged higher after having stayed flat for the majority of the day and were last seen rising between 0.3% and 0.4%.
In case risk flows start to dominate the financial markets following Wall Street’s opening bell, the US Dollar could have a difficult time holding its ground and open the door for a rebound in EUR/USD.
EUR/USD Technical Analysis
EUR/USD declined into the lower half of the ascending regression channel coming from early January. The Relative Strength Index (RSI) indicator on the four-hour chart stays comfortably above 50, suggesting that the latest pullback is part of a technical correction.
On the downside, 1.0860 (static level) aligns as interim support before 1.0840 (lower limit of the ascending channel). Only a four-hour close above the latter could be seen as a bearish development and trigger an extended slide toward 1.0820 (50-period Simple Moving Average (SMA)) and 1.0800 (psychological level).
First resistance is located at 1.0880 (mid-point of the ascending channel) ahead of 1.0900 (psychological level) and 1.0920 (upper-limit of the ascending channel).
