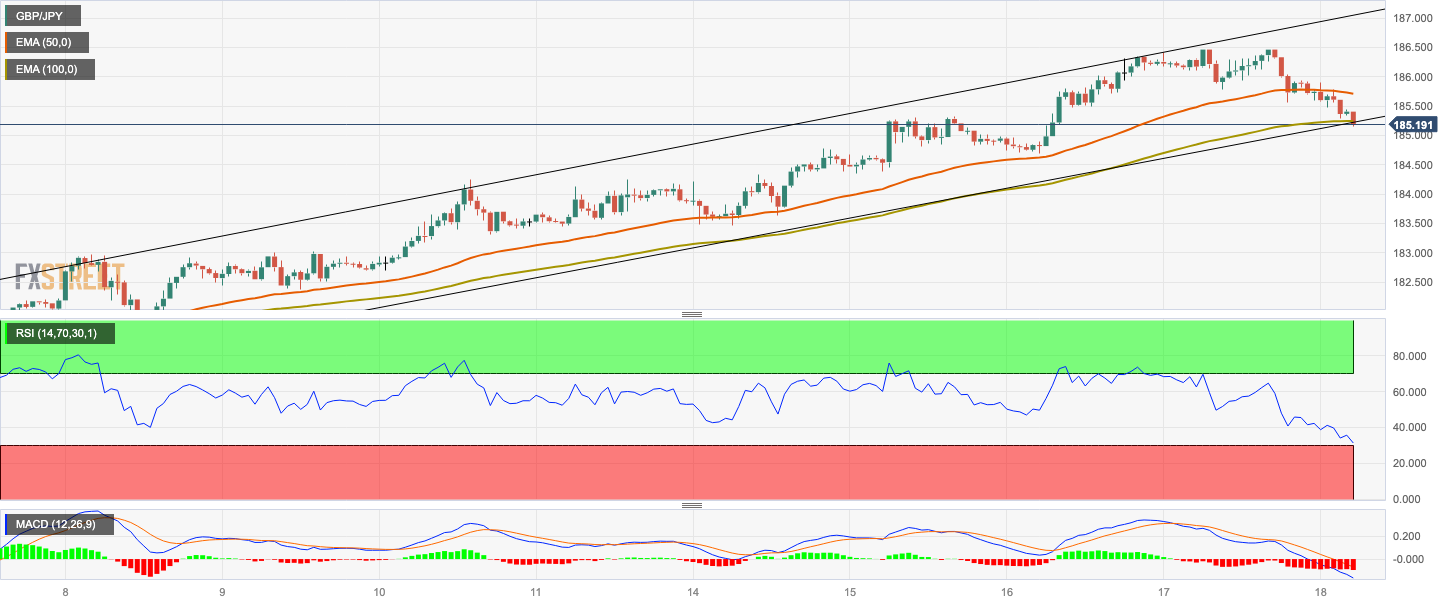
- GBP/JPY cross trades within an ascending trend-channel on the one-hour chart.
- The next support level is located at 184.35; the first resistance level is seen at 185.70.
- The Relative Strength Index (RSI) and MACD stand in bearish territory.
The GBP/JPY cross remains under pressure for the second consecutive day heading into the early European session on Friday. Market turn cautious amid the fear of China’s debt crisis and real-estate woes, which boost the Japanese Yen, a traditional safe-haven currency. However, the release of the UK Retail Sales could provide a clear direction for the cross.
On Thursday, Evergrande, China’s second-largest real estate company filed for bankruptcy in a US court under Chapter 15. This report fuels the fear of a potential Chinese property catastrophe. Furthermore, Fitch Ratings revealed on the same day that they might reconsider China’s A+ sovereign credit rating in the face of intensifying economic headwinds. This, in turn, exerts pressure on the Pound Sterling and acts as a headwind for GBP/JPY.
From the technical perspective, the GBP/JPY cross trades within an ascending trend-channel since August 4 on the one-hour chart. The cross stands below the 50- and 100-hour Exponential Moving Averages (EMAs) with a downward slope, which means the path of the least resistance is to the downside.
That said, a decisive break below 185.20 (the lower limit of the ascending trend-channel and 100-hour EMA) will see a drop to 184.70 (low of August 16). The next contention is located at 184.35 (high of August 14). The additional downside filter to watch is the 184.00–184.10 region, representing a psychological round figure. The key support level is located at 183.00, portraying a confluence of a high of August 8 and the round mark.
On the upside, GBP/JPY’s immediate resistance level is seen at 185.70 (50-hour EMA). Any meaningful follow-through buying will see the next stop at 186.35 (a weekly high of December 4, 2015). The critical barrier is seen at 187.00 (a round figure and a weekly high of November 27, 2015).
It’s worth noting that the Relative Strength Index (RSI) is located below 50, while the Moving Average Convergence/Divergence (MACD) stand in bearish territory. Both momentum indicators highlight that further downside cannot be ruled out.
