- GBP/USD has extended its sideways grind below 1.2200 on Wednesday.
- UK Chancellor Hunt will unveil budget in Parliament around 1230 GMT.
- The near-term technical outlook suggests that bullish bias stays intact.
Following the three-day rally, GBP/USD staged a technical correction and registered small losses on Tuesday. Early Wednesday, the pair has been moving in a relatively tight range below 1.2200 as investors await the UK budget announcements.
After the data from the US showed that the Core Consumer Price Index (CPI) rose by 0.5% in February, compared to the market expectation and January reading of 0.4%, the US Dollar managed to keep its footing. Investors started to price in a 25 basis points Federal Reserve rate hike at next week’s meeting and US Treasury bond yields rebound following the sharp decline that was triggered by the collapse of Silicon Valley Bank.
Meanwhile, Britain has extended its support for household energy prices by three months, to the end of June, keeping in place a price cap that will see average annual bills stay at £2,500. This development could suggest that households will have more disposable income during that period, which could be inflationary in the short term.
British Finance Minister (Chancellor) Jeremy Hunt is expected to unveil the budget in Parliament around 1230 GMT on Wednesday. Hunt will reportedly introduce additional child-care support, worth around £4 billion, and investment in skills training.
The impact of soft UK wage inflation data on the pricing of the Bank of England’s (BoE) next rate decision seems to have faded already. According to Reuters, the probability of a 25 bps rate increase at the next BoE meeting has increased to 70% from around 40% on Tuesday.
In the second half of the day, February Retail Sales and Producer Price Index data will be featured in the US economic docket. Although a stronger-than-expected monthly Core PPI, at or above 0.5%, could help the US Dollar hold its ground, the market reaction is likely to remain short-lived. Instead, market participants will keep a close eye on the US Treasury bond yields and the performance of Wall Street’s main indexes.
Another bout of risk rally in the American session should hurt the USD and vice versa.
GBP/USD Technical Analysis
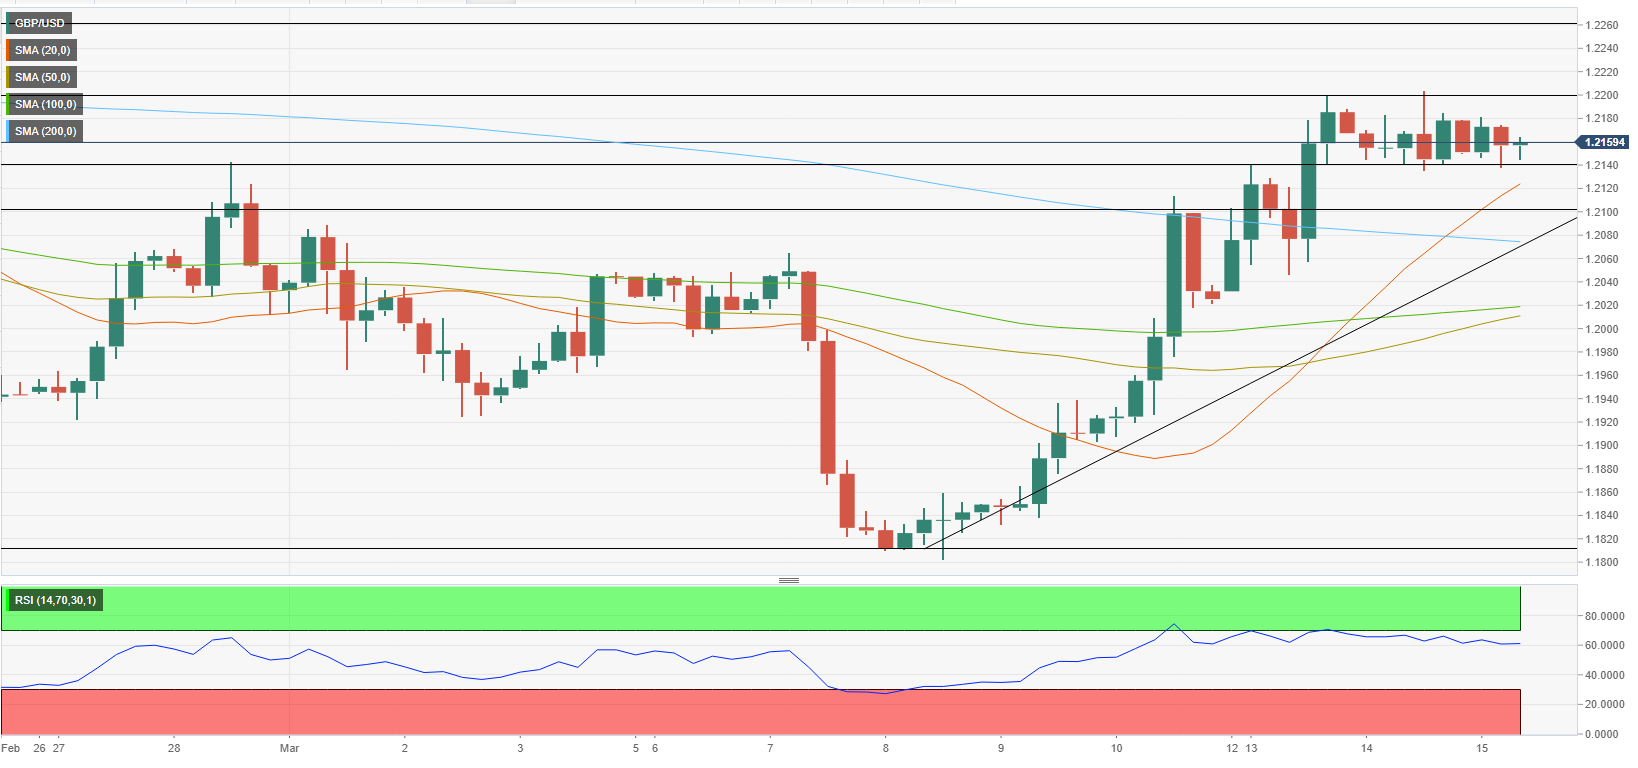
GBP/USD seems to have formed a short-term trading channel between 1.2140 and 1.2200. The Relative Strength Index (RSI) indicator on the four-hour chart holds comfortably above 50, suggesting that sellers remain uninterested for the time being.
On the upside, a four-hour close above 1.2200 (static level, psychological level) could bring in additional buyers and open the door for an extended rally toward 1.2260 (static level) and 1.2300.
Below 1.2140, 1.2100 (psychological level, static level) aligns as next support before 1.2075 (200-period SMA) and 1.2040 (100-day SMA).
