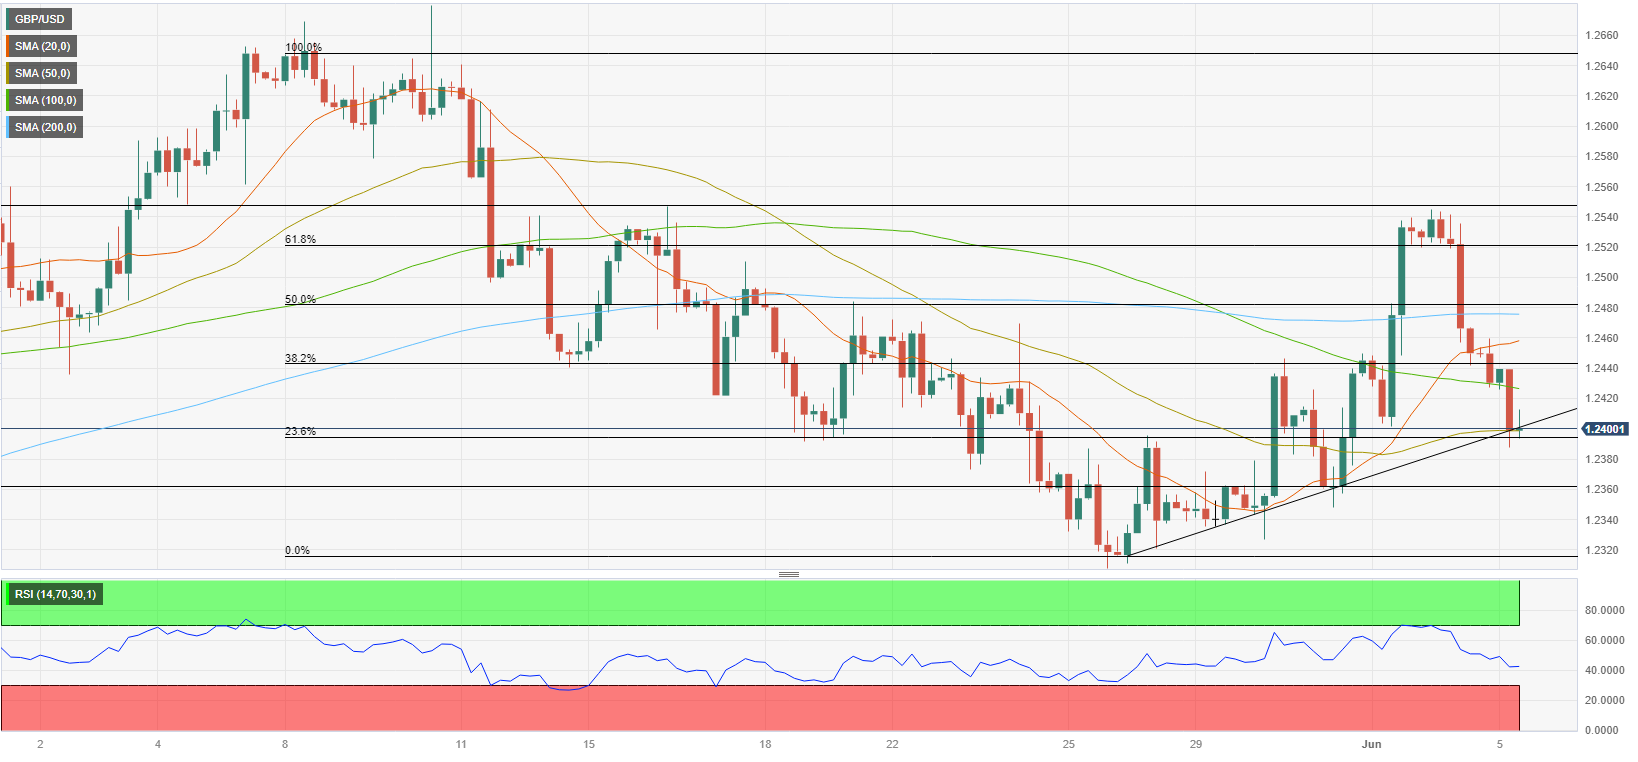
- GBP/USD has edged lower toward 1.2400 in the European morning on Monday.
- The pair could stage a rebound in case risk mood continues to improve.
- Investors will pay close attention to the inflation component of the ISM Services PMI.
GBP/USD has extended its decline to test 1.2400 in the European morning on Monday. Sellers could move to the sidelines and allow the pair to stage a recovery in the near term if that level proves to be strong support.
Renewed US Dollar (USD) strength ahead of the weekend caused GBP/USD to erase a large portion of its weekly gains. After the US Bureau of Labor Statistics (BLS) reported on Friday that Nonfarm Payrolls (NFP) rose 339,000 in May, compared to the market expectation of 190,000, the US Dollar Index (DXY) gained nearly 0.5%.
Early Monday, the DXY clings to small daily gains above 104.00 supported by rising US Treasury bond yields. Nevertheless, the CME Group FedWatch Tool’s probability of a 25 basis points (bps) Federal Reserve (Fed) rate hike stays below 30%, highlighting that the upbeat NFP reading had little to no impact on the market pricing of the next Fed rate decision.
On the other hand, markets are fully pricing in one more 25 (bps) Bank of England rate increase in June to 4.75% and see a terminal rate close to 5.5%. Hence, the diverging policy outlooks of these two major central banks could help GBP/USD limit its losses in the near term.
In the second half of the day, the ISM Services PMI report for May will be featured in the US economic docket. In case the headline PMI stays comfortably above 50 and the Prices Paid Index of the survey rises unexpectedly, hawkish Fed bets could provide an additional boost to the USD and weigh on the pair. On the flip side, a disappointing headline PMI below 50 and a softer inflation component should have the opposite effect on the pair.
Meanwhile, the UK’s FTSE 100 Index is up more than 0.5% in the early European session while US stock index futures trade mixed. A continuation of the risk rally witnessed in Wall Street on Friday should make it difficult for the USD to find demand and vice versa.
GBP/USD Technical Analysis
GBP/USD trades near 1.2400, where the Fibonacci 23.6% retracement of the latest downtrend, the 50-period Simple Moving Average on the four-hour chart and the ascending trend line align. If GBP/USD continues to use that area as support, it could recover toward 1.2430/40 (100-period SMA, Fibonacci 38.2% retracement) and 1.2480 (200-period SMA, Fibonacci 50% retracement).
On the downside, sellers could remain interested and drag GBP/USD toward 1.2360 (static level) and 1.2320 (end-point of the latest downtrend) in case 1.2400 support fails.
