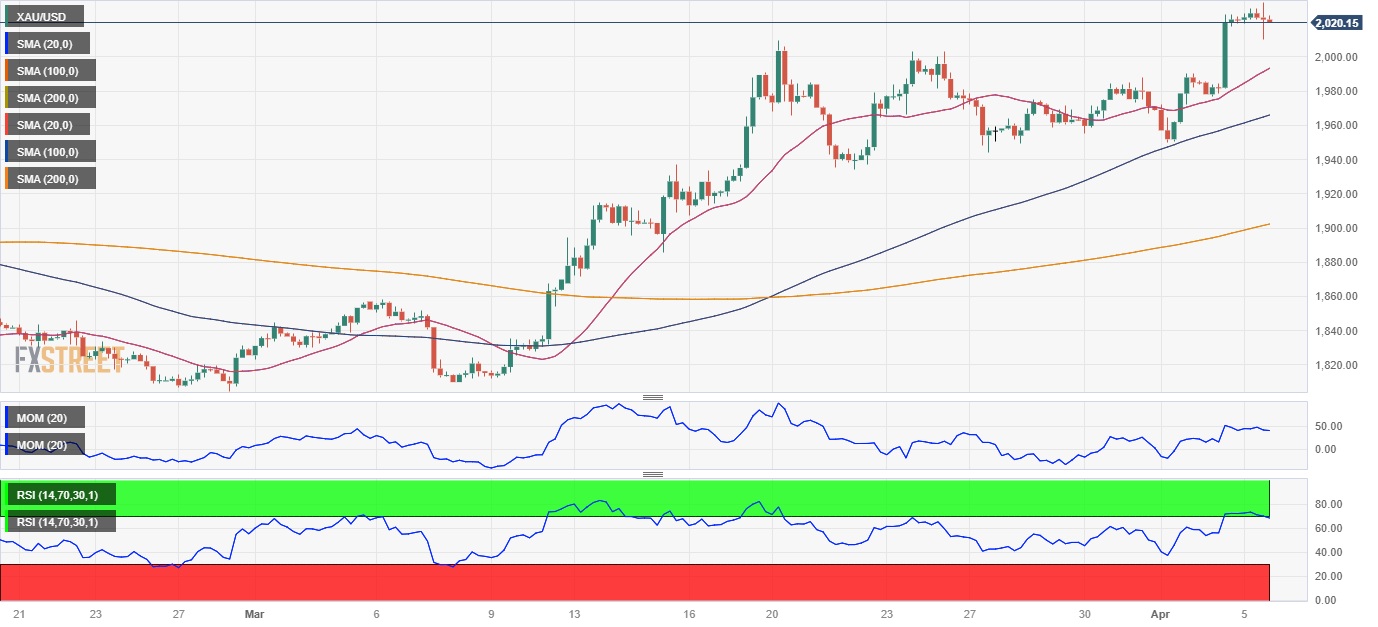
XAU/USD Current price: $2,020.20
- Dismal United States data maintains the USD on the back foot despite a souring mood.
- Stock markets struggle to leave the red, government bond yields ease.
- XAU/USD consolidates gains with the bullish bias still intact.
Spot gold extended its advance to a fresh multi-month high of $2,032.03 a troy ounce on Wednesday, correcting lower afterwards. Market players are taking some profits out of the table ahead of the long holiday, as multiple markets will be closed or with reduced activity in the last two days of the week amid the Easter Holiday. Still, XAU/USD is currently hovering around $2,020 and retaining most of its weekly gains.
The US Dollar stays on the back foot, with demand undermined by softer-than-anticipated American data. Indeed, the poor figures spurred some risk aversion, which usually supports the Greenback, but the market focus remains on the idea the United States Federal Reserve (Fed) is about to hit a pause on rate hikes, making the USD less attractive in the longer run.
Among other less relevant figures, the US published the ISM Services PMI, which declined by much more than anticipated, printing at 51.2 in March vs 55.1 in February. Additionally, the ADP survey on private job creation posted a modest 145K gain in March, missing the 200K expected and worse than the previous 261K.
Meanwhile, Wall Street trades mixed, with only the Dow Jones Industrial Average holding on to modest intraday gains. On the other hand, Treasury yields are down, with the 10-year note currently offering 3.27%, reflecting market concerns.
XAU/USD price short-term technical outlook
From a technical point of view, the daily chart for the XAU/USD pair shows that it managed to post a higher high and a higher low, which skews the risk to the upside. Technical indicators in the mentioned time frame remain well into positive territory, lacking directional strength yet without signs of upward exhaustion. At the same time, the bright metal develops above bullish moving averages, with the 20 Simple Moving Average (SMA) heading firmly north above the longer ones while below the current price.
In the near term, and according to the 4-hour chart, XAU/USD has lost bullish momentum but remains far from turning bearish. Technical indicators rotated lower, but their downward strength is limited while they hold within overbought readings. Finally, Gold remains well above bullish moving averages, with the 20 SMA providing dynamic support at around $1,991.20
Support levels: 2,009.70 1,991.20 1,982.10
Resistance levels: 2,024.90 2,037.85 2,050.00
