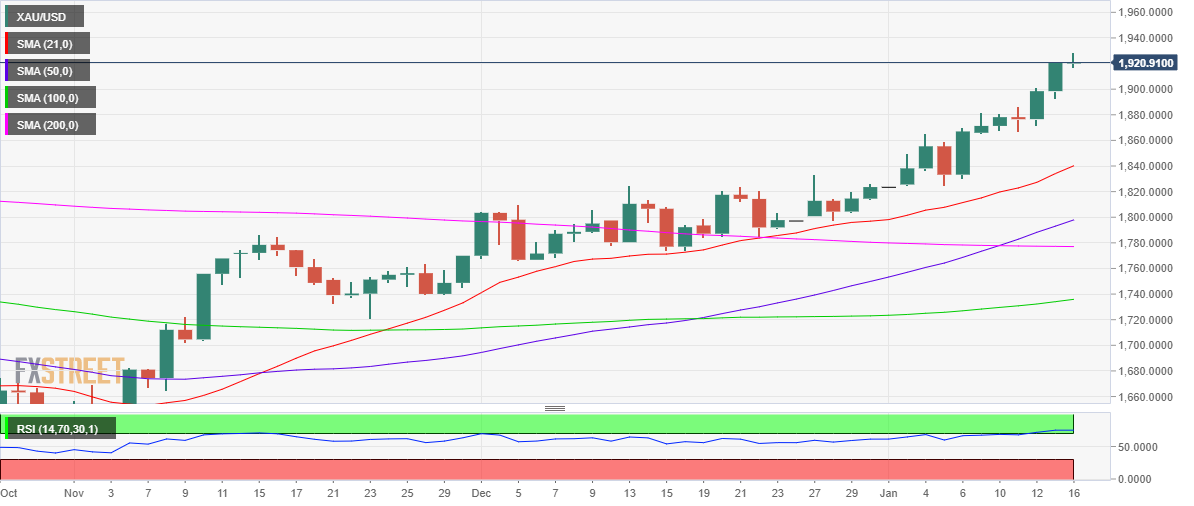
- Gold price holds at nine-month highs near $1,930 amid a strong start to the week.
- US Dollar falls further on hopes of slower Federal Reserve rates hikes, USD/JPY drop.
- United States holiday could prompt high volatility amid thin liquidity.
- Gold price could see a pullback, as Relative Strength Index holds well above 70.00.
Gold price is taking a breather near the highest level seen since April 2022 at $1,929, as investors contemplate the next move amid a holiday in the United States. The US stocks and bond markets are closed on Monday, in observance of Martin Luther King Jr. Day.
United States Dollar faces a double whammy
The bearish pressure around the United States Dollar remains unabated at the start of the week, helping Gold price to gain further ground above the $1,900 mark. The US Dollar faces a double whammy so far in Monday’s trading, as the sell-off in the USD/JPY pair is having an adverse effect alongside increased expectations that the US Federal Reserve (Fed) will hike rates at a slower pace amid softening United States Consumer Price Index (CPI). USD/JPY is under intense selling on hopes that the Bank of Japan (BoJ) could hint toward a hawkish pivot at its policy meeting this week, as the central bank fails to defend its yields’ policy, despite extensive bond-buying.
Meanwhile, markets are now pricing 25 basis points (bps) Federal Reserve rate hikes in February and March after the headline United States Consumer Price Index for December increased 6.5% over the 12 months while the core CPI dropped to 5.7% YoY, meeting estimates and against November’s 6%. The Federal Reserve peak rate is expected to be around 4.97%, well below the previous expectations of between 5.0%-5.25%.
Thin trading to extend amid United States holiday
Holiday-thinned market conditions are likely to extend ahead, keeping the volatility around Gold price relatively high amid risks of exaggerated moves. Also, investors could resort to repositioning ahead of the United States Retail Sales data and China’s Gross Domestic Product (GDP ) due later this week while a slew of speeches from the US Federal Reserve policymakers will be also closely scrutinized for the world’s most powerful central bank’s future policy path.
Gold price technical analysis: Daily chart
Gold price has pulled back sharply from a nine-month top of $1,929, as suggested by an overbought 14-day Relative Strength Index (RSI). The daily RSI currently stands at 75.21, well past the critical 70.00 level.
On its way down, strong support awaits at the $1,920 round level, below which the intraday low at $1,917 could be revisited. A sustained break below the latter could trigger a further correction toward the $1,900 threshold.
On the flip side, if Gold bulls manage to regain control and take out the multi-month high, then a fresh upswing toward the $1,940-$1,941 supply zone could be in the offing. The next stop for Gold buyers is seen at $1,950, the psychological level.
