- Gold price seesaws around the highest levels since June 2022 as multiple technical indicators probe bulls.
- Recent shift in Fed talks, US inflation expectations also probe the XAU/USD bulls.
- Fed’s Powell needs to defend aggressive rate hikes to tease Gold bears.
Gold price (XAU/USD) retreats from the eight-month high as bulls struggle to keep the reins ahead of this week’s key catalysts. The metal’s pullback could also be linked to the fresh doubts on the China-linked optimism in the markets as a news piece from Bloomberg flagged Covid fears for the world’s second-largest economy, as well as one of the biggest Gold consumers. Additionally probing the XAU/USD buyers could be the latest shift in the Federal Reserve (Fed) talks as Atlanta Fed President Raphael Bostic and San Francisco Federal Reserve Bank President Mary Daly defends the rate hike trajectory ahead of Fed Chair Jerome Powell’s speech. It should be noted that the cautious mood ahead of Wednesday’s China Consumer Price Index (CPI) and the US CPI data, up for publishing on Thursday, also challenge the Gold buyers.
Also read: Gold Price Forecast: Optimistic buyers maintain the upward pressure
Gold Price: Key levels to watch
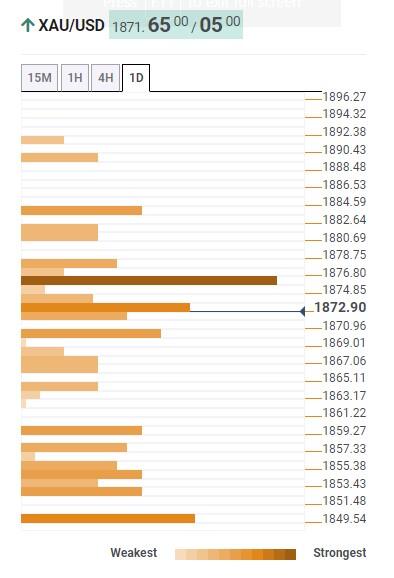
The Technical Confluence Detector shows that the Gold price retreats from the key resistance level surrounding $1,877, comprising Fibonacci 38.2% one-day and Pivot Point one-month R2.
Even if the metal manages to cross the $1,877 hurdle, the Pivot Point one-week R1, around $1,885, will precede the Pivot Point one-day R2 near $1,890 to challenge the Gold buyers before offering them the $1,900 threshold.
Meanwhile, a convergence of the previous weekly high and lower band of the Bollinger on the hourly chart, close to $1,868, limits the immediate downside of the XAU/USD.
Following that, a slump toward the $1,860 support comprising Fibonacci 23.6% in one week can’t be ruled out.
However, multiple hurdles stand tall to challenge the Gold bears between $1,860 and $1,851 while Pivot Point one-month R1 appears a tough nut to crack for the XAU/USD sellers around $1,850.
Here is how it looks on the tool
About Technical Confluences Detector
The TCD (Technical Confluences Detector) is a tool to locate and point out those price levels where there is a congestion of indicators, moving averages, Fibonacci levels, Pivot Points, etc. If you are a short-term trader, you will find entry points for counter-trend strategies and hunt a few points at a time. If you are a medium-to-long-term trader, this tool will allow you to know in advance the price levels where a medium-to-long-term trend may stop and rest, where to unwind positions, or where to increase your position
