- Gold is on the verge of a significant bullish turnaround, but it all depends on the Fed.
- Technically, the bulls need to hang on above hourly support and break a daily H&S neckline.
The gold price is higher by some 0.70% on the day as the US dollar continues to bleed out in a risk-on environment following the Bank of Canada’s dovish rate hike ahead of next week’s Federal Reserve interest rate decision. US bond yields have slipped on expectations that the Federal Reserve will temper its aggressive rate-hike stance starting December which has enabled the precious metal to firm up within a broader bearish technical picture.
DXY and yields on the backfoot
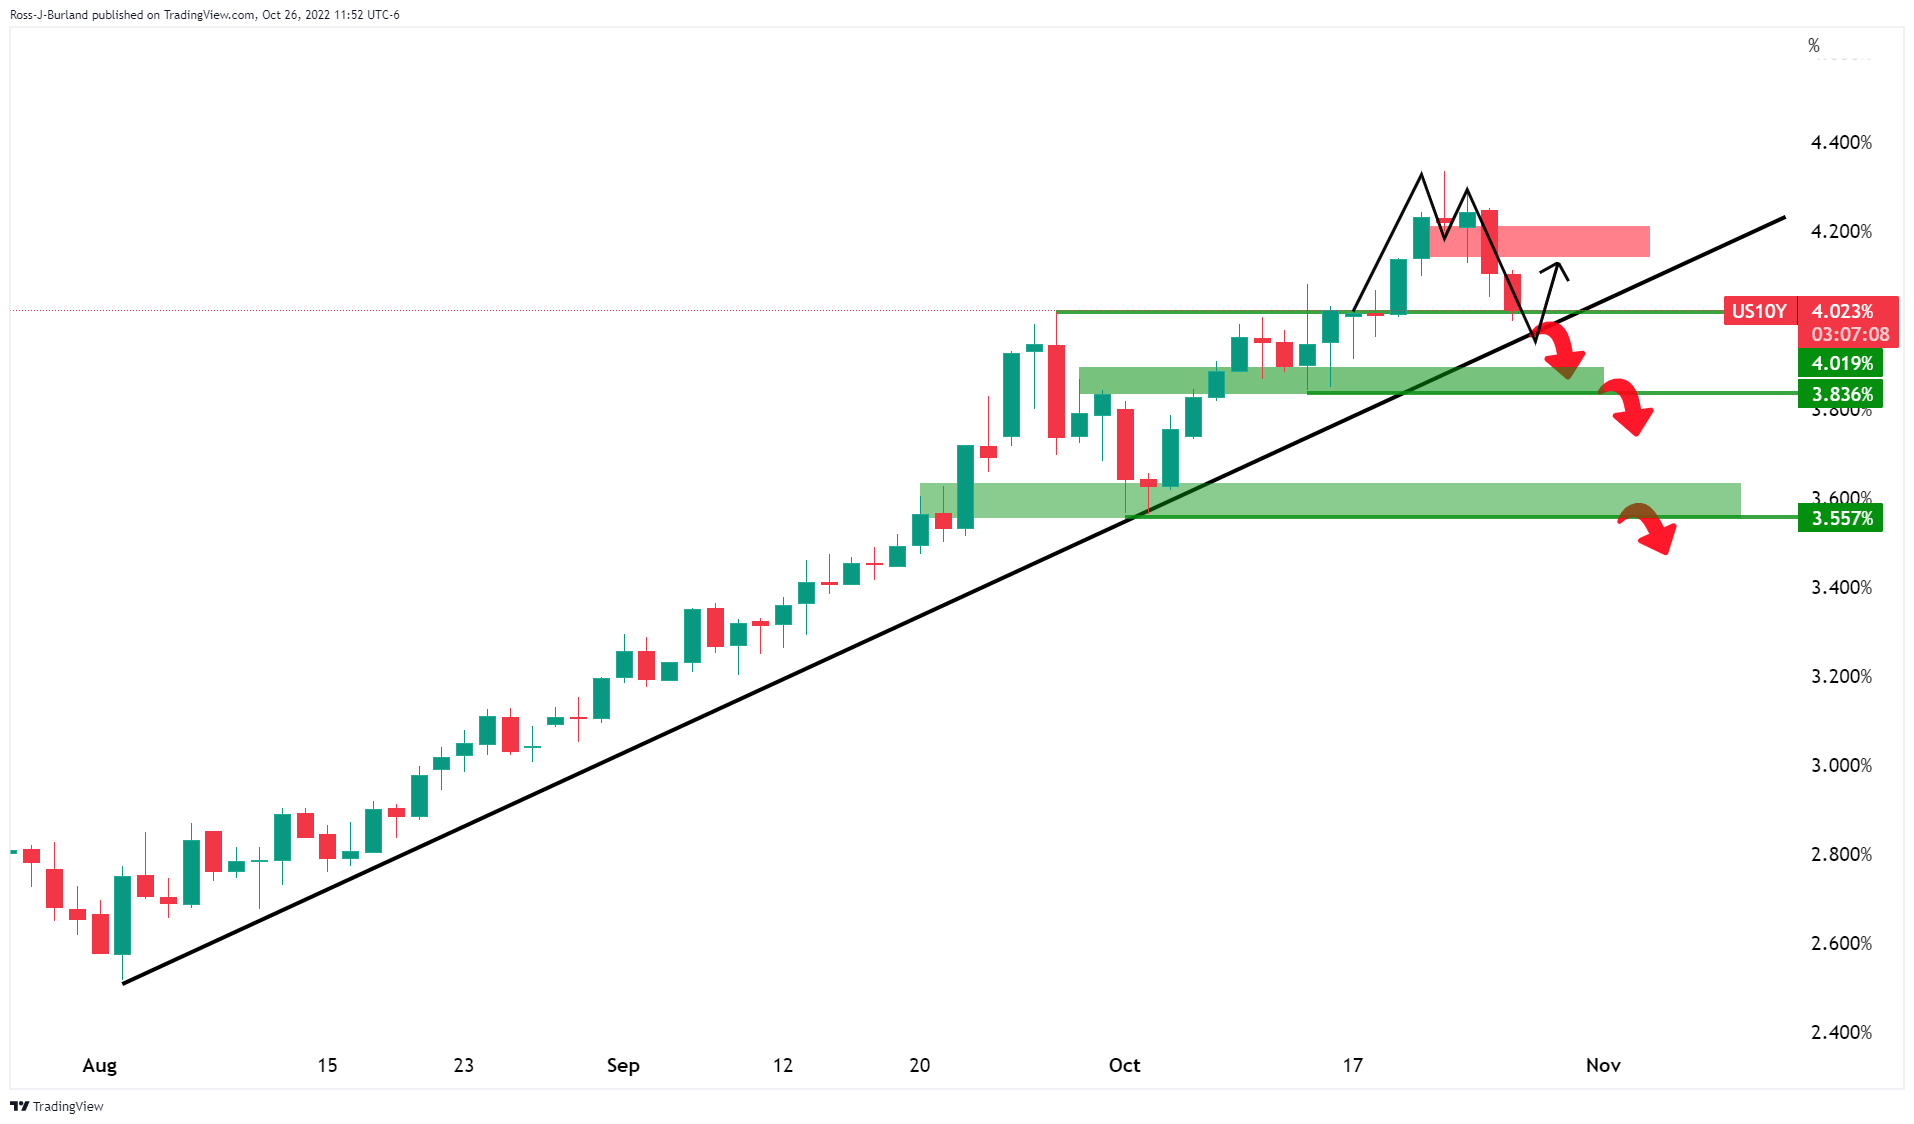
At the time of writing, XAU/USD is trading at $1,665 having travelled between a low of $1,649.81 the low and $1,675.00 the high. The DXY, an index that measures the greenback vs. a basket of currencies is losing some 1.00% on the day having dropped from a high of 111.135 to a low of 109.649 while the US 10-year yield is down 1.95% from a high of 4.113%, clinging on to 4%, just a touch above the lows of 3.997% as it moves in on technical support:
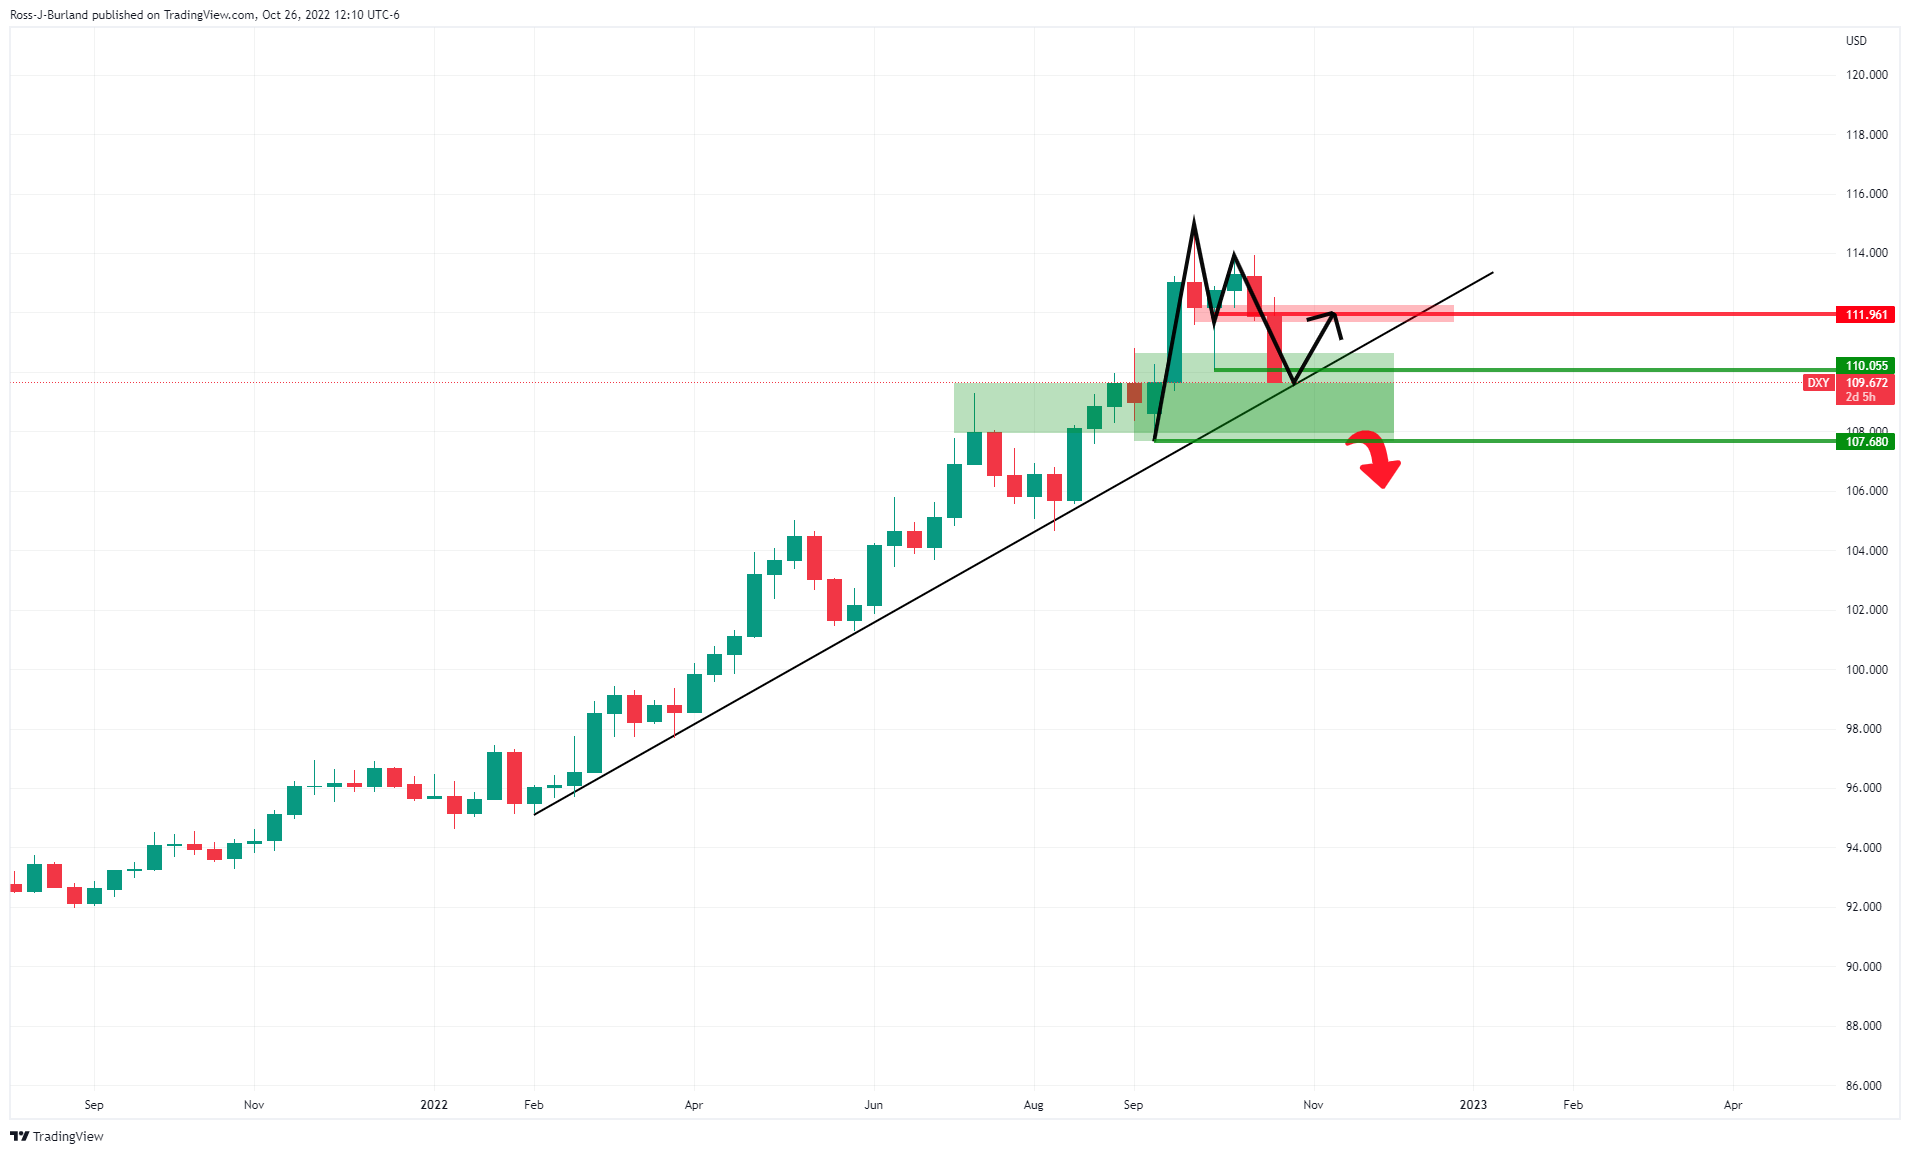
This Benchmark has now dropped to a one-week low, but the bond market might not be too hasty to totally write off a hawkish Fed and price in a Fed pivot entirely until the outcome of next week’s meeting. This leaves the M-formation compelling on the daily charts as a reversion pattern that coexists with critical trendline and horizontal support which will likely see the vicinity of 4.00% as a robust area in the meantime, hamstringing gold prices as the DXY will find support:
DXY weekly chart
All depends on data and the Fed
Meanwhile, ”we reiterate that precious metals have yet to discount the implications of a prolonged period of restrictive rates that should continue to weigh on prices,” analysts at TD Securities argued.
On the other hand, data will be key as central bankers, such as with the BoC today, will be reluctant to raise rates further which would be a positive environment for gold. Nevertheless, the Fed is still widely expected to raise the interest rate by 75 basis points in November and the yellow metal is sensitive to rising US interest rates, as they increase the opportunity cost of holding non-yielding bullion. Ahead of the event, US Gross Domestic Product data on Thursday, followed by US core inflation numbers on Friday could be the clincher before the event as investors might wish to front run it due to what clarity on the Fed rate-hike trajectory might come in the data. There will also be the European Central Bank meeting. it is worth noting that the ECB has failed to see the euro rally in several past meetings, fuelling a bid in the greenback.
Gold technical analysis
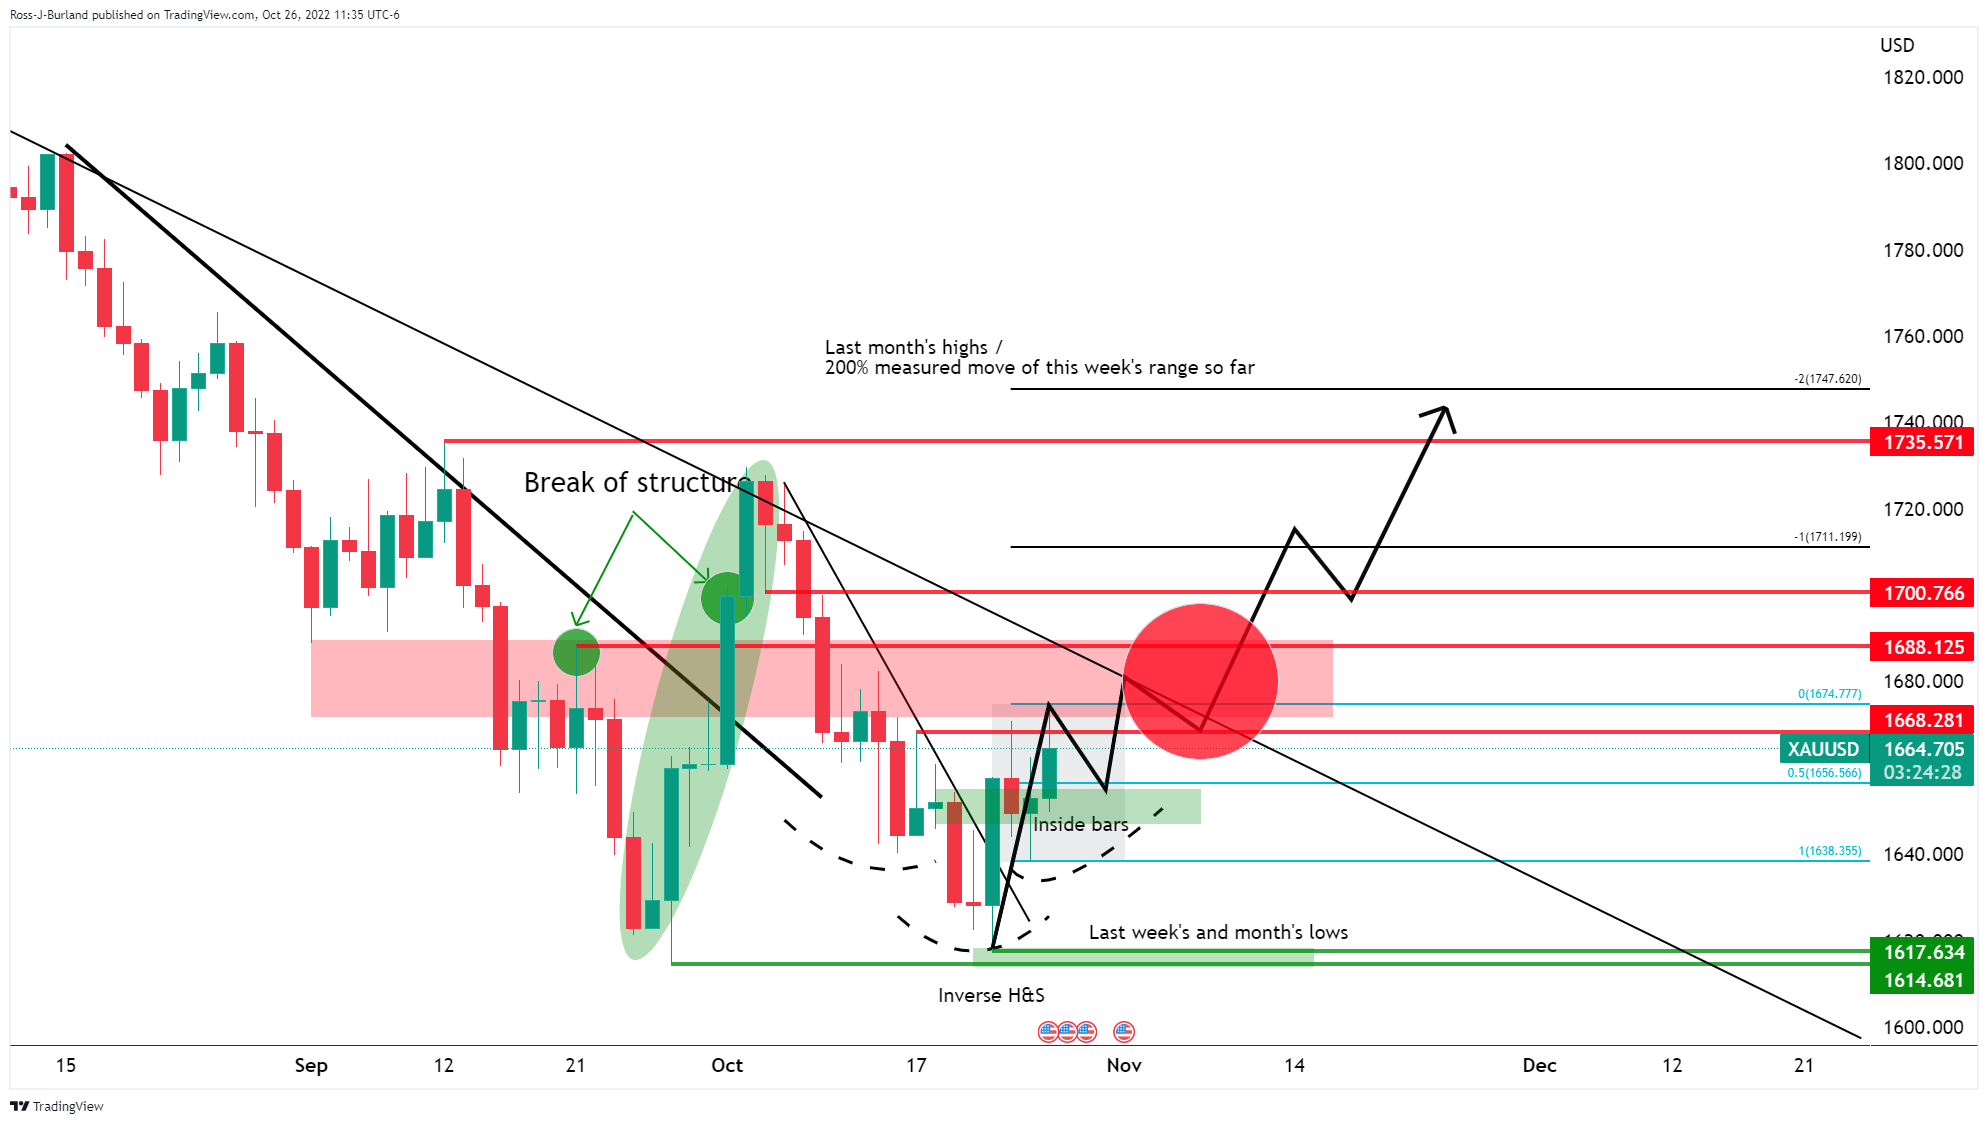
The daily chart, above, shows a number of bullish confluences. We had a break in daily structure back on Oct 3 to take the gold price on the back side of the daily trendline resistance. The price moved back into Wednesday 22 Sep bullish peak formation lows in a micro daily bear trend. We have broken on the backside of the micro (secondary) daily trendline on Fri 22 Oct and we have two prior inside days that are being broken today (bullish). This could be cementing the formation of an inverse head and shoulders for a 150% measured move of this week’s range so far to target last month’s highs of near $1,735. A close above the $1,670 neckline could be the trigger point to start looking for the set-up on lower time frames.
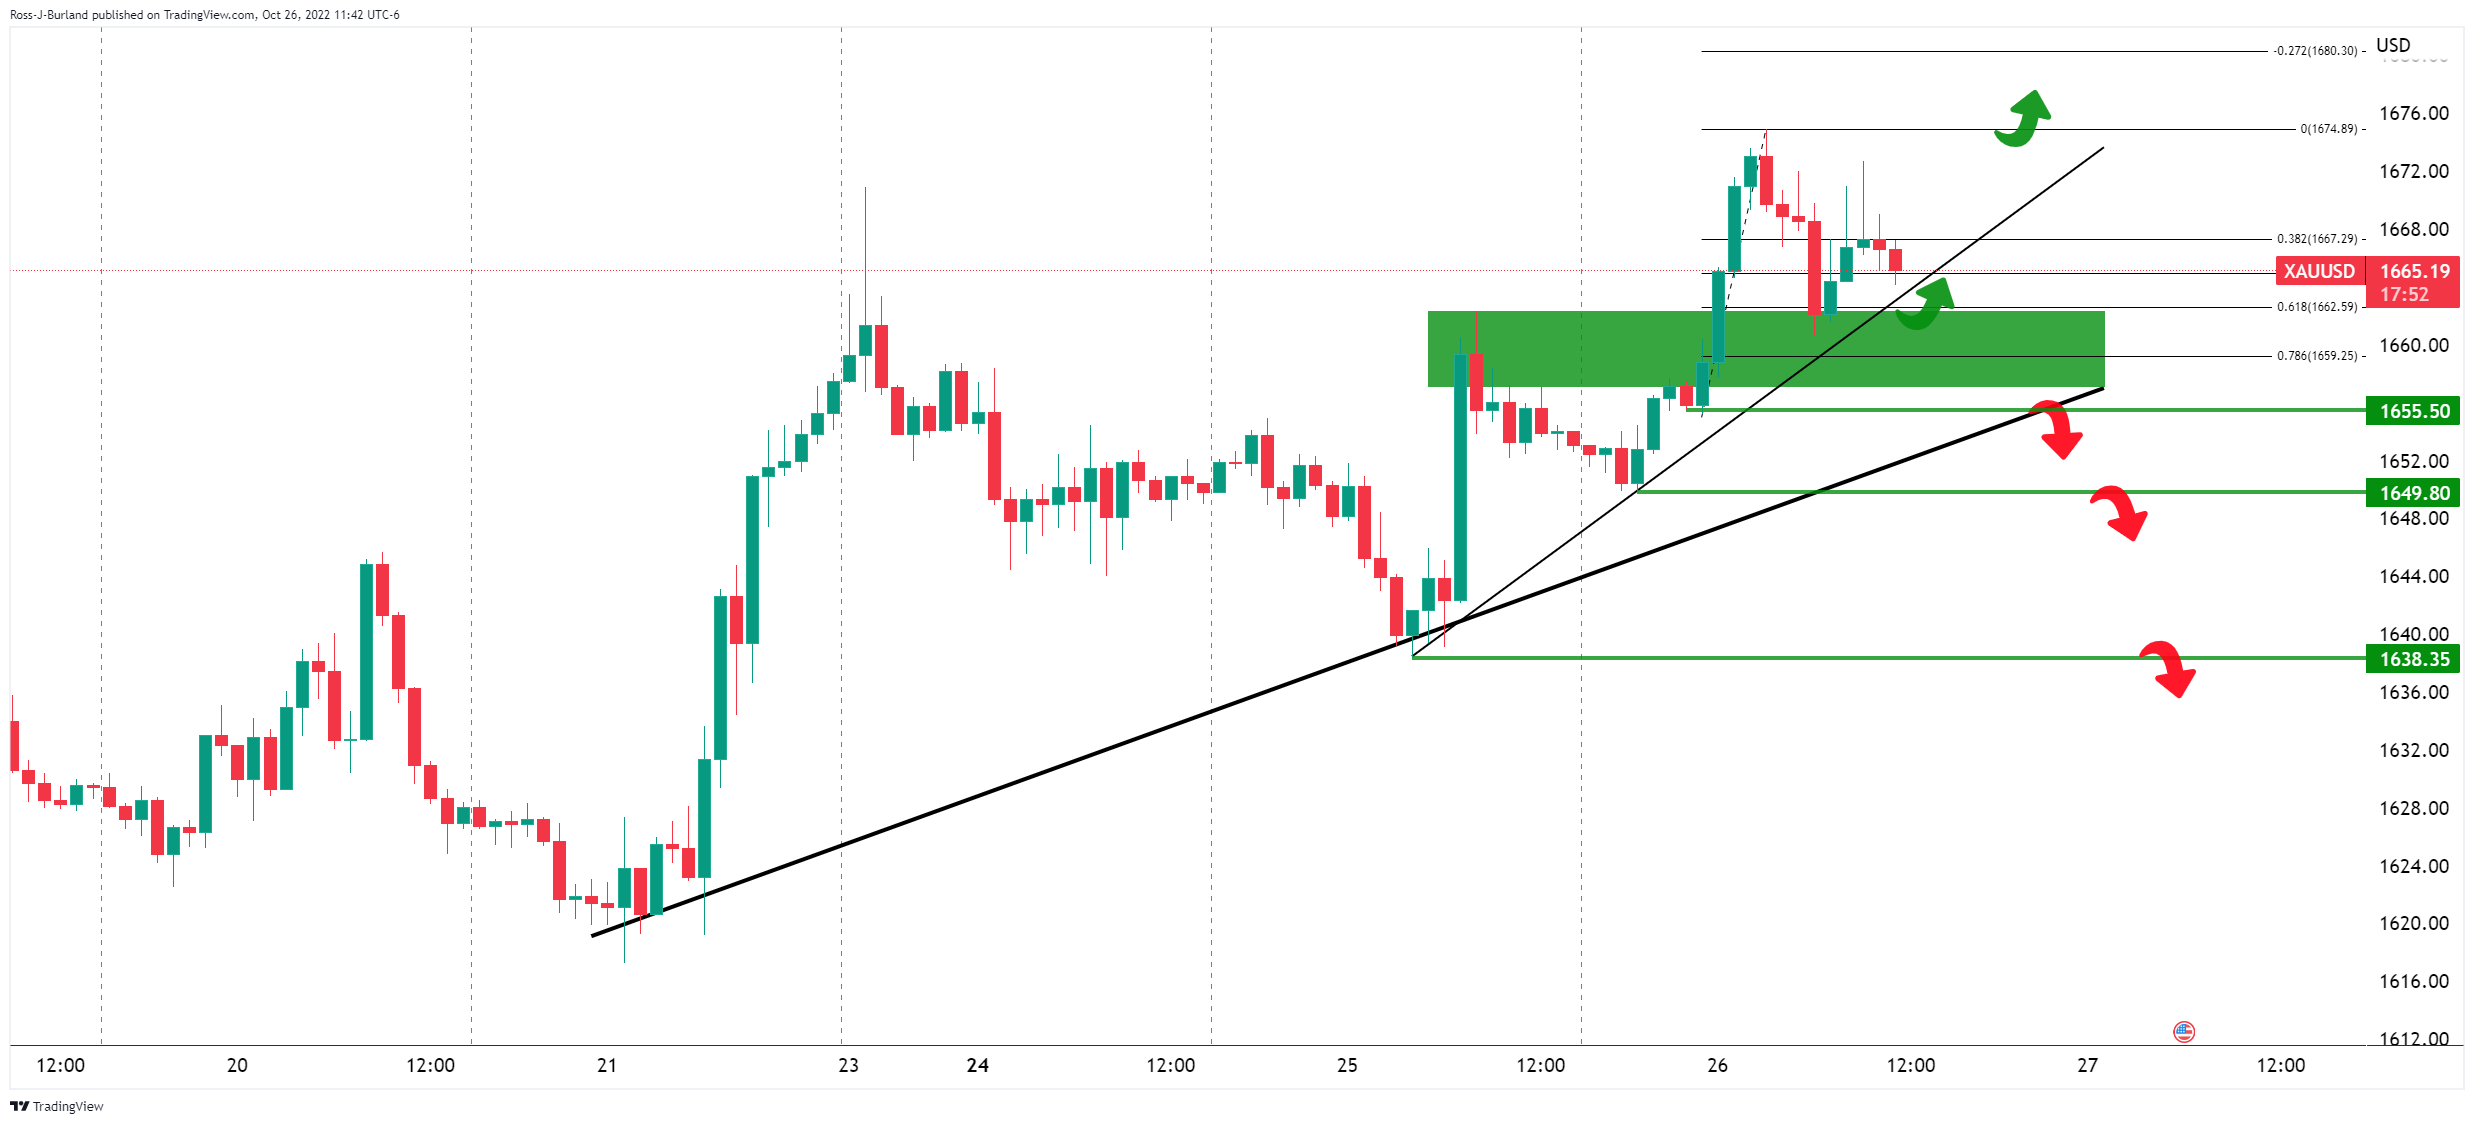
The daily chart is bullish but the hourly charts are starting to paint a different story. The bulls need to commit over the next day to the trendline supports or face the pressures below as illustrated above.


