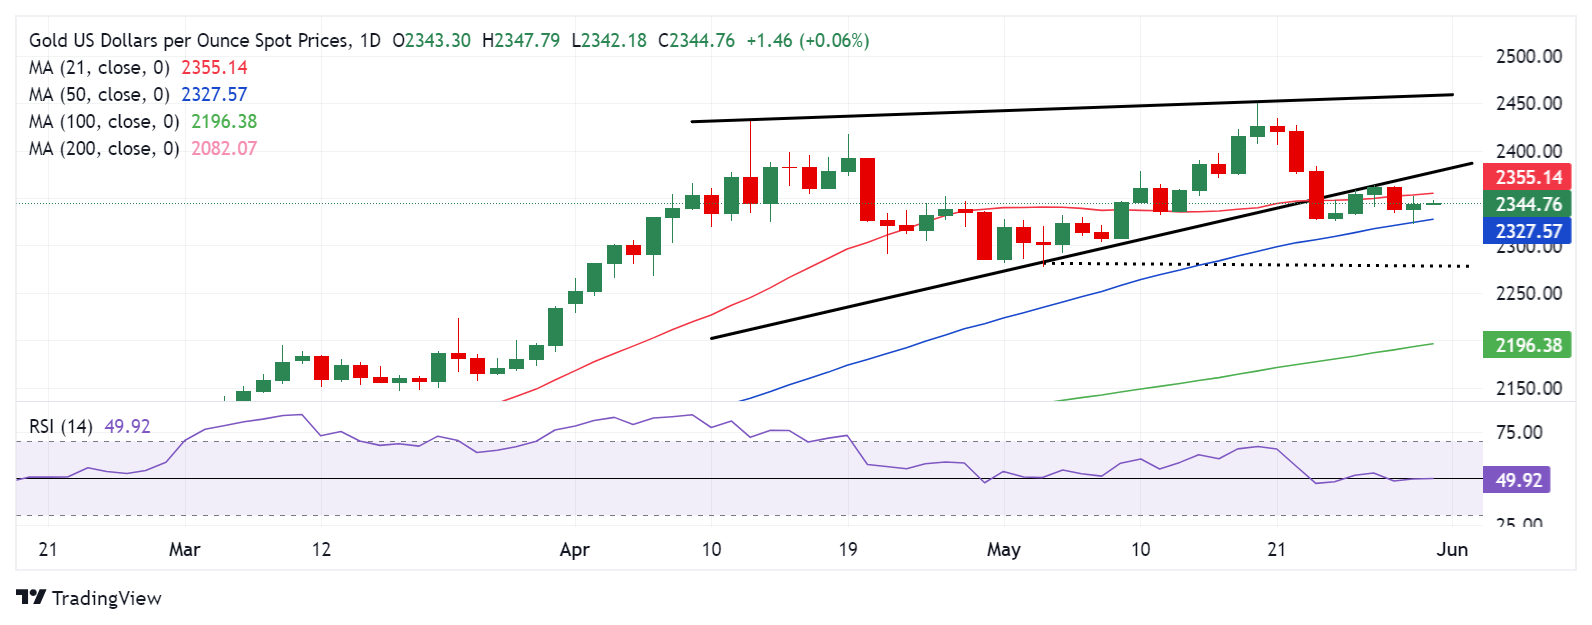
- Gold price holds the previous bounce early Friday, eyes fourth monthly gains.
- The US Dollar finds its feet again on a dour mood, despite weak US Treasury bond yields.
- The daily RSI prods the 50 level, as Gold price managed to defend the key 50-day SMA support at $2,328.
Gold price is consolidating the previous bounce but remains confined in a narrow range near $2,350 early Friday. Gold price awaits the highly anticipated US Core Personal Consumption Expenditure (PCE) Price Index, the Federal Reserve’s preferred inflation measure, for a fresh directional impetus.
All eyes remain on US PCE inflation data
Markets have heavily pared back expectations for more than one Fed interest rate hike this year, in the wake of inflation persistence combined with the recent hawkish Fed commentaries. According to the CME FedWatch Tool, markets are pricing about 50% odds that the Fed will hold rates in September while the probability of a November rate cut stands at around 64%.
The hawkish Fed expectations had revived the demand for the US Dollar across the board, as the US Treasury bond yields rallied to multi-week highs. However, Thursday’s downward revision to the annualized first-quarter US Gross Domestic Product (GDP) data to 1.3% from 1.6% in the first estimate and a modest increase in the Initial Jobless Claims acted as a headwind to the US Dollar’s upside, fuelling a Greenback sel-off alongside the US Treasury bond yields.
This helped Gold price attempt a modest comeback, having incurred steep losses on Wednesday. Looking ahead, it remains to be seen if Gold price can hold its renewed upside, as its fate hinges on the US Core PCE inflation data due later in American trading on Friday. Core PCE Price Index is expected to rise 2.8% YoY in April, at the same pace as seen in March.
A surprise uptick in the Core figure will reinforce delayed and less aggressive Fed rate cut expectations, providing extra legs to the US Dollar decline while smashing Gold price. Conversely, the Gold price could build on the rebound should the data show an unexpected softness in the Core PCE inflation, ramping up bets for a September Fed rate cut.
Gold price technical analysis: Daily chart
As observed on the daily chart, the Gold price rebound remains capped below the 21-day Simple Moving Average (SMA) at $2,355.
Meanwhile, buyers continue to defend the key 50-day SMA support at $2,328
The 14-day Relative Strength Index (RSI) is prodding the 50 level, suggesting a lack of clear directional bias for Gold price.
A hot US Core PCE inflation print could trigger a downside break of the 50-day SMA at $2,328. A sustained move below the latter will open the floor for a test of the $2,300 mark.
The next key downside cap is seen at the May 3 low of $2,277.
Alternatively, Gold price could rise above the 21-day SMA at $2,355 in a bid to recapture the rising wedge support-turned-resistance, then at $2,376, if the US inflation data surprises to the downside.
Acceptance above the abovementioned barrier at $2,376 could pave the way for the buyers to challenge the May 24 high of $2,384.
Gold FAQs
Gold has played a key role in human’s history as it has been widely used as a store of value and medium of exchange. Currently, apart from its shine and usage for jewelry, the precious metal is widely seen as a safe-haven asset, meaning that it is considered a good investment during turbulent times. Gold is also widely seen as a hedge against inflation and against depreciating currencies as it doesn’t rely on any specific issuer or government.
Central banks are the biggest Gold holders. In their aim to support their currencies in turbulent times, central banks tend to diversify their reserves and buy Gold to improve the perceived strength of the economy and the currency. High Gold reserves can be a source of trust for a country’s solvency. Central banks added 1,136 tonnes of Gold worth around $70 billion to their reserves in 2022, according to data from the World Gold Council. This is the highest yearly purchase since records began. Central banks from emerging economies such as China, India and Turkey are quickly increasing their Gold reserves.
Gold has an inverse correlation with the US Dollar and US Treasuries, which are both major reserve and safe-haven assets. When the Dollar depreciates, Gold tends to rise, enabling investors and central banks to diversify their assets in turbulent times. Gold is also inversely correlated with risk assets. A rally in the stock market tends to weaken Gold price, while sell-offs in riskier markets tend to favor the precious metal.
The price can move due to a wide range of factors. Geopolitical instability or fears of a deep recession can quickly make Gold price escalate due to its safe-haven status. As a yield-less asset, Gold tends to rise with lower interest rates, while higher cost of money usually weighs down on the yellow metal. Still, most moves depend on how the US Dollar (USD) behaves as the asset is priced in dollars (XAU/USD). A strong Dollar tends to keep the price of Gold controlled, whereas a weaker Dollar is likely to push Gold prices up.
