- Gold price consolidates the previous rebound above $2,400, as US PMIs grab attention.
- Risk-aversion, Treasury yields rebound continue to support the US Dollar.
- Gold price’s path of least resistance appears to the upside amid favorable technicals.
Gold price is looking to build on the previous rebound above $2,400 in Asian trading on Wednesday, despite a buoyant tone seen around the US Dollar (USD) and the US Treasury bond yields. Gold traders now look forward to the global preliminary business PMI data for fresh trading impetus.
All eyes turn to global PMI data
The US Dollar clings to recovery gains, as risk-aversion remains the underlying theme early Wednesday, with Asian stocks under pressure following the big US tech earnings disappointment. After the US market closed on Tuesday, traders saw an unimpressive start to the earnings reports from the “Magnificent Seven” megacap technology companies.
Although Google parent Alphabet delivered a beat on both the top and bottom lines, the company’s chief signaled patience will be needed to see concrete results from artificial intelligence investments. Meanwhile, Tesla fell as much as 7% after profit fell short of estimates and the electric-vehicle giant delayed its Robotaxi event to October.
Additionally, traders also remain wary over mounting China’s economic slowdown worries, supporting the haven demand for the Greenback.
On Tuesday, the US Dollar found its feet and staged a decent comeback, mainly driven by the market’s anxiety ahead of the key US corporate earnings report. The US Treasury bond yields also rebounded firmly, notwithstanding the cautious market environment.
Investors resorted to profit-taking on their USD shorts, as the economic calendar gets heated up from Wednesday. Global preliminary Manufacturing and Services PMI data will likely highlight the health of the economies, especially that of the Eurozone and the US, having a significant bearing on risk sentiment.
Weak PMI data could revive recessionary fears, putting a fresh bid under the safe-haven US Dollar. However, the non-yielding Gold price could also benefit from such a scenario, as US ‘hard-land’ fears could reinforce dovish Federal Reserve (Fed) expectations.
Markets are currently pricing in a September rate cut, as futures show a 97% chance, according to the CME Group’s FedWatch Tool.
All eyes also remain on the critical US Gross Domestic Product (GDP) report for the second quarter on Thursday and Personal Consumption Expenditures (PCE) inflation data for June on Friday for more Gold price action.
Gold price technical analysis: Daily chart
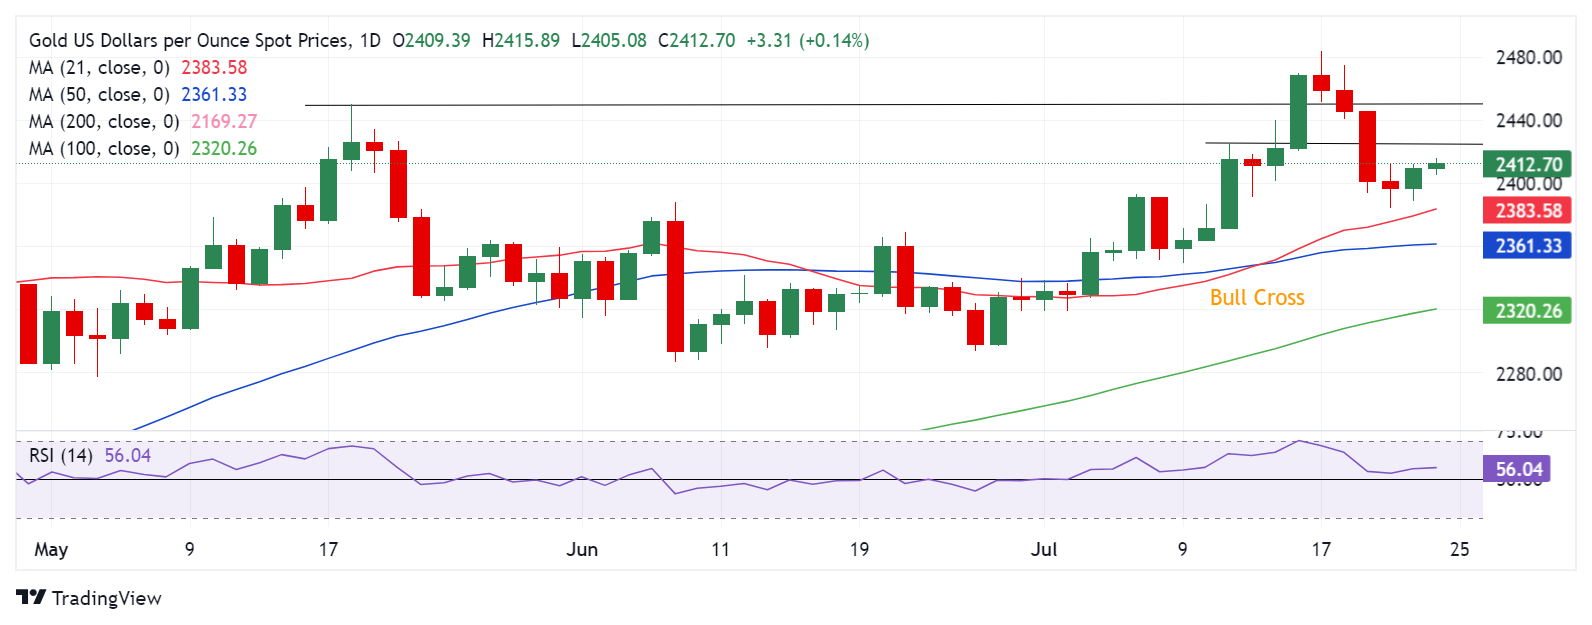
The short-term technical outlook for Gold price remains favorable, as the 14-day Relative Strength Index (RSI) continues to stay bullish above the 50 level.
The 21-day and 50-day Simple Moving Averages (SMA) Bull Cross also remains in play, justifying the constructive outlook for Gold price.
On the upside, the immediate resistance is seen at the $2,425 static resistance, above which the previous lifetime high at $2,450 will be challenged. The next relevant upside target is seen at the new all-time high of $2,484 reached last week.
Alternatively, Gold price fall back to the 21-day SMA support at $2,383 if buyers fail to sustain at the $2,425 supply zone.
If the selling pressure intensifies, Gold price could seek support from the 50-day SMA at $2,361, below which a test of the $2,350 psychological level will be inevitable.
Economic Indicator
S&P Global Composite PMI
The S&P Global Composite Purchasing Managers Index (PMI), released on a monthly basis, is a leading indicator gauging US private-business activity in the manufacturing and services sector. The data is derived from surveys to senior executives. Each response is weighted according to the size of the company and its contribution to total manufacturing or services output accounted for by the sub-sector to which that company belongs. Survey responses reflect the change, if any, in the current month compared to the previous month and can anticipate changing trends in official data series such as Gross Domestic Product (GDP), industrial production, employment and inflation. The index varies between 0 and 100, with levels of 50.0 signaling no change over the previous month. A reading above 50 indicates that the private economy is generally expanding, a bullish sign for the US Dollar (USD). Meanwhile, a reading below 50 signals that activity is generally declining, which is seen as bearish for USD.
Next release: Wed Jul 24, 2024 13:45 (Prel)
Frequency: Monthly
Consensus: –
Previous: 54.8
Source: S&P Global