XAU/USD Current price: $1,740.33
- Market focus is on the FOMC Meeting Minutes and US Durable Goods Orders to be out on Wednesday.
- Wall Street trades with a better tone after Monday’s weakness, enough to limit USD strength.
- XAUUSD trades with a soft tone in the near term, although well above a critical support level at $1,720.75.
The American Dollar lost steam on Tuesday, shedding some ground against its major rivals. XAUUSD recovered modestly throughout the first half of the day, reaching an intraday high of $1,748.81 a troy ounce. The Greenback recovered ground against the bright metal and ahead of the US opening, retaining it despite Wall Street’s strength. Spot gold eased from the mentioned high and currently trades at around $1,740.
Financial markets are quietly waiting for the FOMC Meeting Minutes and US Durable Goods Orders to be out on Wednesday, as the macroeconomic calendar has had nothing relevant to offer so far this week. The US Federal Reserve hiked rates by 75 bps for a fifth consecutive meeting earlier in the month, and market players were hoping for a hint on policy pivoting. The meeting’s accompanying statement could be understood as a sign of potential easing in the pace of quantitative tightening, although chief Jerome Powell’s words surprised markets with a hawkish tone. The FOMC Meeting Minutes may shed some light on whatever the Fed may do in December, and market players will likely rush to price it in.
XAU/USD price short-term technical outlook
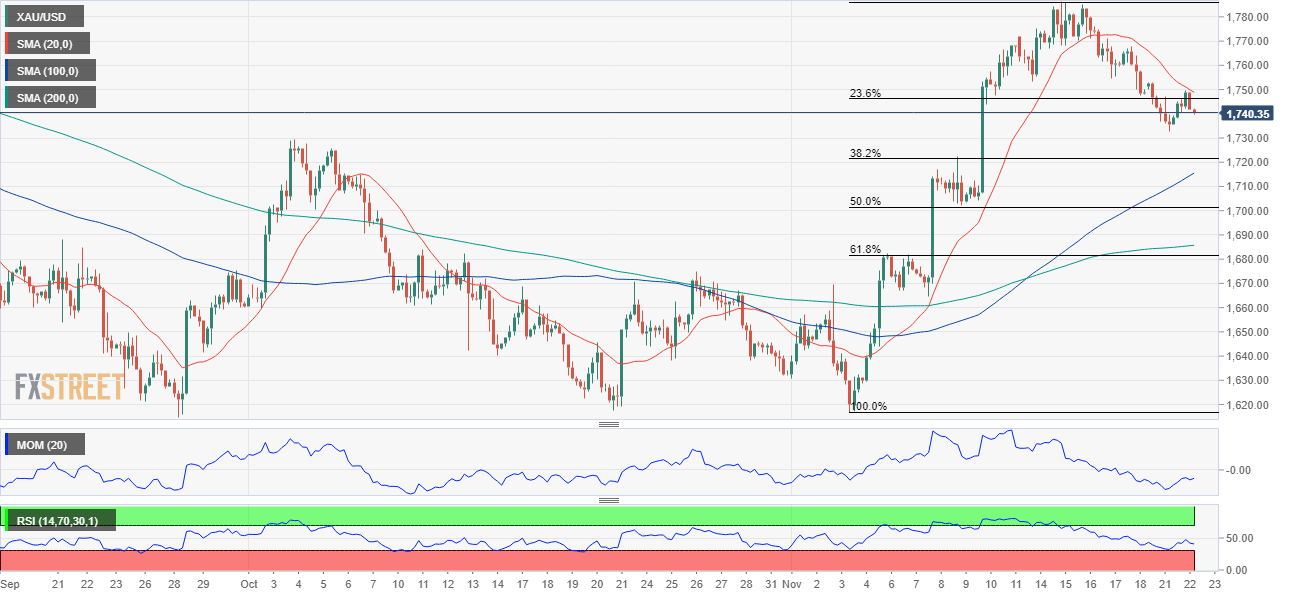
The XAU/USD pair briefly traded above the 23.6% retracement of its latest daily advance between $1,616.52 and $1,786.46 at $1,745.46, but it is back below the level. The daily chart shows that bulls are trying to return, as technical indicators pared their declines after correcting overbought readings and are aiming marginally higher. At the same time, the 20 SMA heads firmly higher, far below the current level, approaching a directionless 100 SMA, somehow skewing the risk to the upside, although without confirming a new leg north.
The 4-hour chart, however, shows that the bullish potential remains limited. A bearish 20 SMA converges with the mentioned daily high, while technical indicators turned marginally lower within negative levels but with limited directional strength. In the meantime, the longer-moving averages maintain their upward slopes below the current level. The bearish case will become clearer if the pair manages to extend its decline below the next Fibonacci support level, the 38.2% retracement of the mentioned rally at $1,720.75.
Support levels: 1,733.00 1,720.75 1,708.30
Resistance levels: 1.745.50 1,758.60 1,771.10