- The Mexican Peso gives up its gains versus the USD following the release of US PMI data for May.
- The data shows both Manufacturing and Services sectors expanded more than analysts had expected.
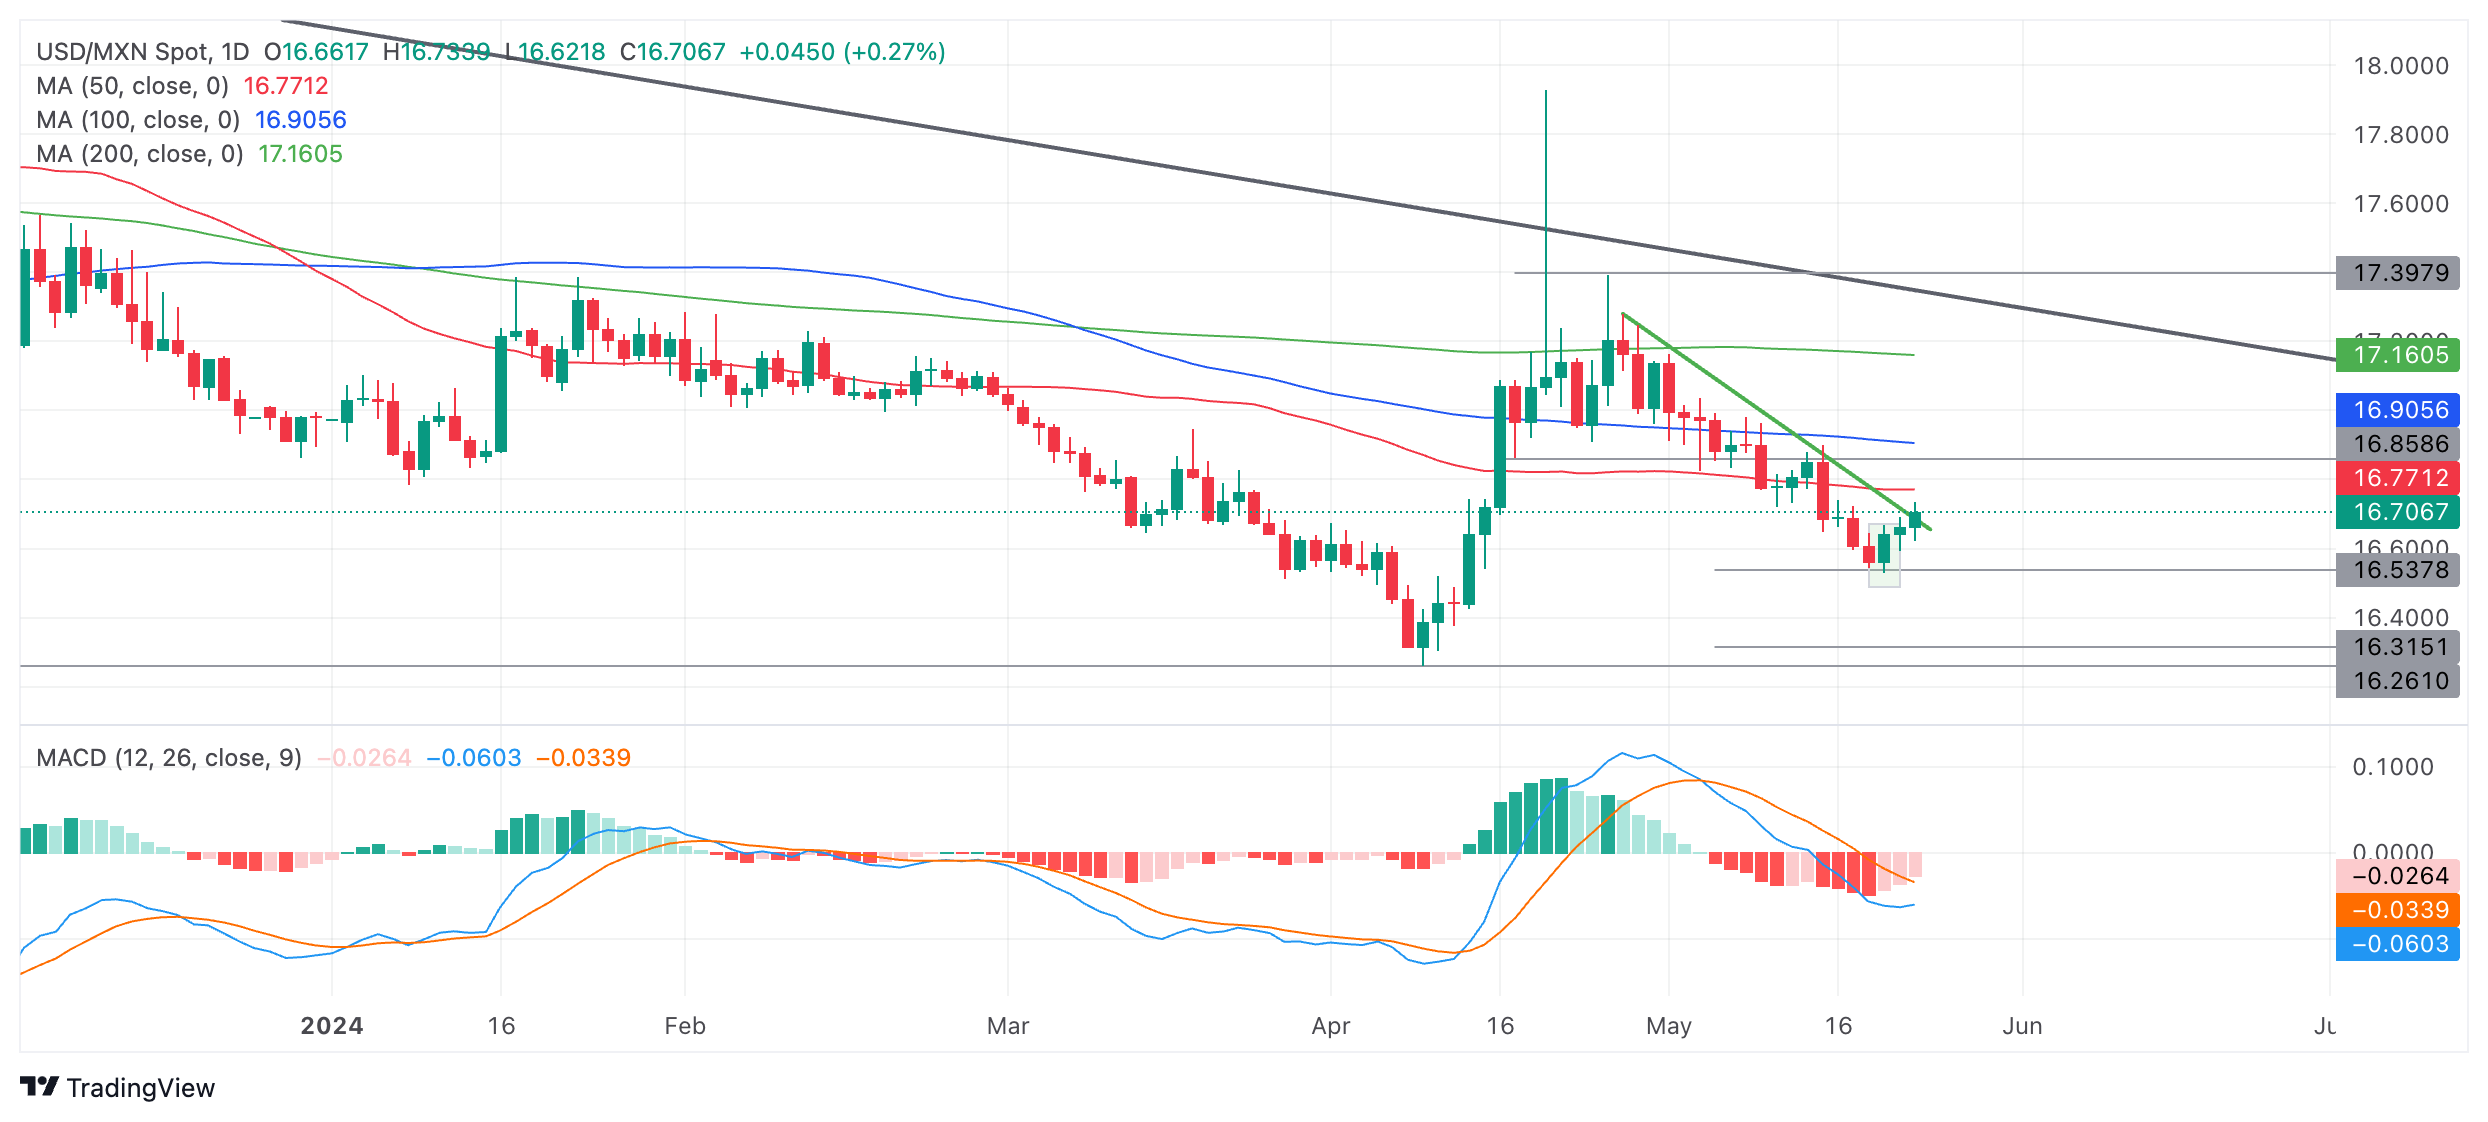
- USD/MXN threatens to reverse the trend after completing a bullish reversal over the last two days.
The Mexican Peso (MXN) gives back all its gains against the US Dollar (USD) on Thursday after the release of US S&P Global Purchasing Manager Index (PMI) data for the Manufacturing and Services sectors in May.
The data showed impressive growth and a greater expansion in both sectors than economists had forecast. The strong US economic data supports the USD and pushes USD/MXN back up above the level of a key trendline, threatening a breakout and reversal of the short-term trend.
USD/MXN is trading at 16.70 at the time of writing, whilst EUR/MXN is trading little changed at 18.09 and GBP/MXN at 21.23.
Mexican Peso weakens versus USD after release of US PMI data
US S&P Global Manufacturing PMI came out at 50.9 in May, up from the 50.0 in April and the 50.0 forecast by economists. Services PMI, meanwhile, rose to 54.8 from 51.3 in the previous month and 51.3 forecast. Composite PMI came out at 54.4 in May, up from 51.3 in April – and beating the decline to 51.1 economists had expected.
The higher-than-expected Services PMI data, in particular, will have supported the US Dollar (USD) as the Federal Reserve (Fed) has highlighted Services-sector inflation as a key hotspot in the economy that needs to cool down before it moves to cut interest rates. The maintenance of higher interest rates supports the USD since it attracts higher inflows of foreign capital compared to lower interest rates.
Mexican GDP rises on revision
The Mexican Peso had risen earlier on Thursday after the release of the final estimate for Mexican Gross Domestic Product (GDP) in Q1 showed an upwards revision of the quarter-on-quarter figure, surprising investors who had expected the growth rate to remain the same as the previous estimate.
The Mexican economy grew by 0.3% in Q1 compared to the previous quarter, up from 0.2% in the previous estimate, according to data from ENEGI released Thursday. The YoY figure, however, showed a GDP growth rate of 1.6% the same as the prior estimate. The upwards revision in the QoQ data gave the Mexican Peso a lift immediately after its release.
The 1st half-month Inflation rate in Mexico, released at the same time, showed prices fell 0.21% which was slightly less than the 0.22% decline expected and may have contributed to the MXN’s gains. 1st half-month Core Inflation, meanwhile, rose by 0.15% as economists had estimates, the data from INEGI showed.
Technical Analysis: USD/MXN meets resistance at trendline
USD/MXN – or the number of Pesos that can be bought with one US Dollar – pressures resistance from the green trendline for the downtrend since April on Thursday.
The pair had formed a bullish reversal day on Tuesday which gained confirmation from the bullish close on Wednesday (shaded rectangle on the chart below).
If USD/MXN can break and close above the green trendline it will signal a reversal in the short-term trend and more bullish outlook over the short-term.
USD/MXN Daily Chart
On Tuesday USD/MXN reached the conservative target for the breakdown out of the range that formed from mid-April to early May.
The pair remains in a downtrend and there is still a risk of further bearishness taking it lower. The next downside target is 16.34, the full height of the range extrapolated lower. A break below the Tuesday low of 16.53 would signal a continuation of the downtrend.
Given the medium and long-term trends are also bearish, the odds further favor more downside.
Economic Indicator
S&P Global Services PMI
The S&P Global Services Purchasing Managers Index (PMI), released on a monthly basis, is a leading indicator gauging business activity in the US services sector. As the services sector dominates a large part of the economy, the Services PMI is an important indicator gauging the state of overall economic conditions. The data is derived from surveys of senior executives at private-sector companies from the services sector. Survey responses reflect the change, if any, in the current month compared to the previous month and can anticipate changing trends in official data series such as Gross Domestic Product (GDP), industrial production, employment and inflation. A reading above 50 indicates that the services economy is generally expanding, a bullish sign for the US Dollar (USD). Meanwhile, a reading below 50 signals that activity among service providers is generally declining, which is seen as bearish for USD.
Last release: Thu May 23, 2024 13:45 (Prel)
Frequency: Monthly
Actual: 54.8
Consensus: 51.3
Previous: 51.3
Source: S&P Global
