- The Mexican Peso hit a 15-week high against the US Dollar on Friday.
- Mexico’s unadjusted Trade Balance hit a nine-month high in November.
- Friday marks the last trading day before the holiday break.
The Mexican Peso (MXN) rallied to a fresh 15-week high on Friday as the broader market took one last opportunity to sell off the US Dollar (USD) heading into the extended holiday weekend.
Mexico’s unadjusted Trade Balance in November beat market expectations and improved to a nine-month high of 630 million in US Dollar terms. However, market impact is likely limited after the seasonally adjusted Trade Balance grew by a scant 300K.
US data drove the market on Friday, with mixed figures pulling Greenback bids in both directions, but the US Dollar heads into the holiday break notably in the red across the board, falling back against the majority of the major currency bloc.
Daily digest market movers: Mexican Peso propped up by Greenback weakness
- MXN hit a 15-week high of 16.94 against the USD on Friday as markets sell the US Dollar off one last time before the holiday break.
- Mexico’s November Trade Balance grew by USD 630 million versus the market forecast of USD 404 million, rebounding from October’s USD 252 million deficit.
- November’s seasonally adjusted Mexico Trade Balance showed scant growth of USD 300K versus the previous month’s growth of USD 242 million, implying seasonal factors are boosting Mexico Trade Balance and are unlikely to last.
- US Dollar weakness is the general market theme on Friday.
- The US Annualized Core Personal Consumption Expenditures (PCE) Price Index in November grew by 3.2% from the same time last year, easing back from market forecasts of 3.3% and declining further from the previous period’s 3.4% (which was also revised down from 3.5%).
- Durable Goods Orders in November lurched higher to grow 5.4%, well over the market forecast of 2.2% and clawing back October’s -5.1% (also revised upwards from -5.4%).
- Easing US inflation figures are keeping market hopes pinned for faster and sooner rate cuts from the Federal Reserve (Fed).
- Mexico’s Jobless Rate figures are due next Thursday after the holiday break.
US Dollar price today
The table below shows the percentage change of US Dollar (USD) against listed major currencies today. US Dollar was the weakest against the Pound Sterling.
| USD | EUR | GBP | CAD | AUD | JPY | NZD | CHF | |
| USD | -0.26% | -0.40% | -0.37% | -0.29% | 0.09% | -0.29% | -0.32% | |
| EUR | 0.26% | -0.15% | -0.10% | -0.03% | 0.32% | -0.03% | -0.05% | |
| GBP | 0.39% | 0.13% | 0.00% | 0.11% | 0.46% | 0.10% | 0.09% | |
| CAD | 0.35% | 0.09% | -0.04% | 0.07% | 0.46% | 0.07% | 0.04% | |
| AUD | 0.29% | 0.04% | -0.09% | -0.09% | 0.38% | 0.01% | -0.01% | |
| JPY | -0.10% | -0.35% | -0.47% | -0.44% | -0.37% | -0.36% | -0.38% | |
| NZD | 0.28% | 0.03% | -0.11% | -0.08% | 0.00% | 0.32% | -0.02% | |
| CHF | 0.27% | 0.06% | -0.09% | -0.03% | -0.02% | 0.39% | 0.03% |
The heat map shows percentage changes of major currencies against each other. The base currency is picked from the left column, while the quote currency is picked from the top row. For example, if you pick the Euro from the left column and move along the horizontal line to the Japanese Yen, the percentage change displayed in the box will represent EUR (base)/JPY (quote).
Technical Analysis: Mexican Peso sees one last bump to close out the trading week
The Mexican Peso (MXN) has captured some ground amidst broad-market US Dollar (USD) weakness on Friday, with the USD/MXN pair definitively piercing below the 17.00 handle for the first time since late August.
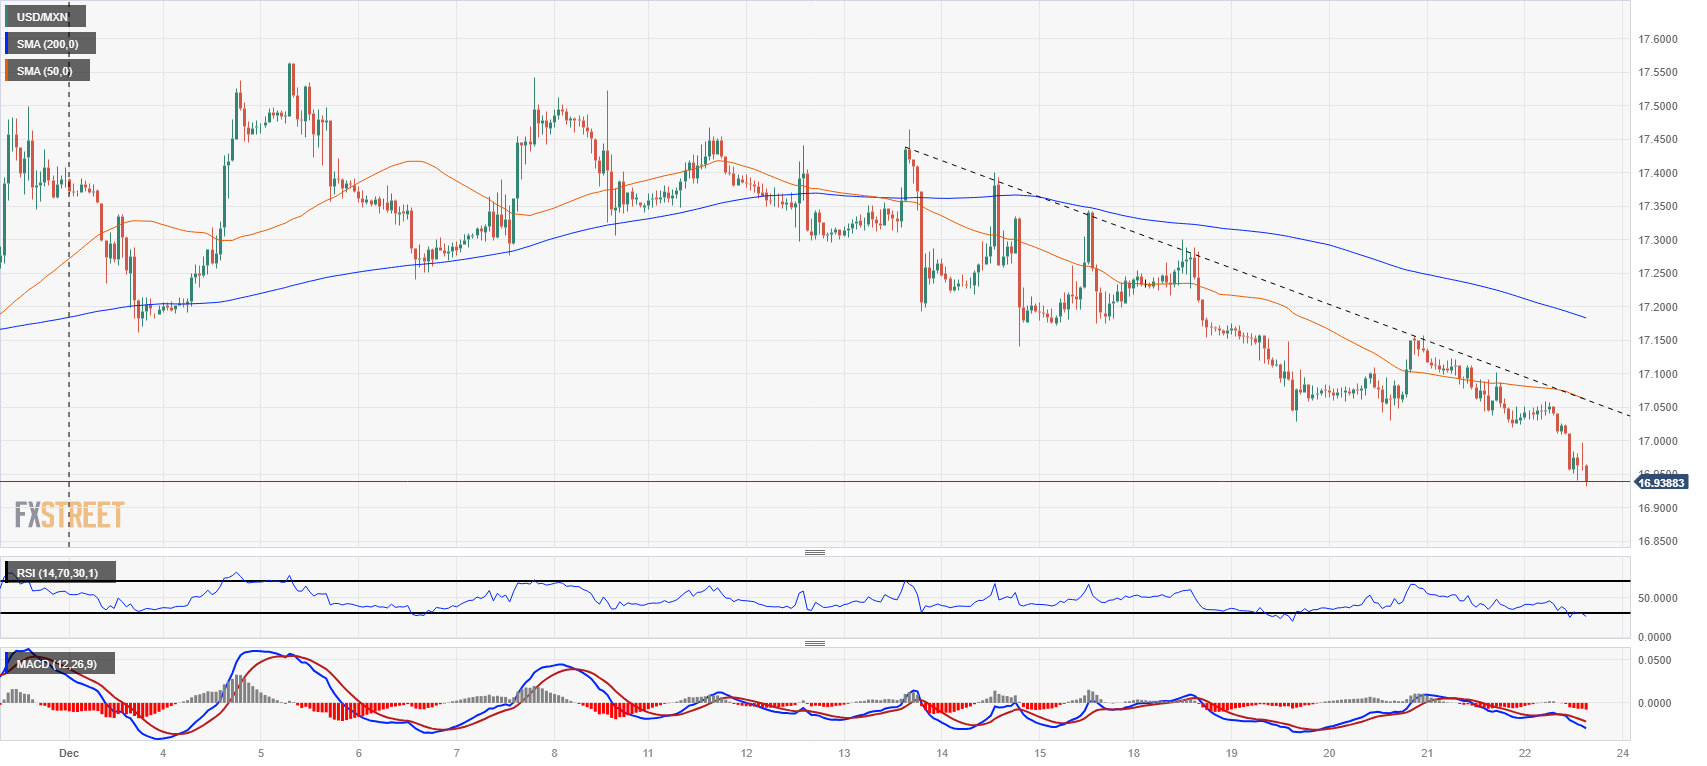
Hourly candles have the USD/MXN running well away from the 200-hour Simple Moving Average (SMA) just below 17.20, and last week’s rough intraday chop has given way to smooth declines heading into the holiday break.
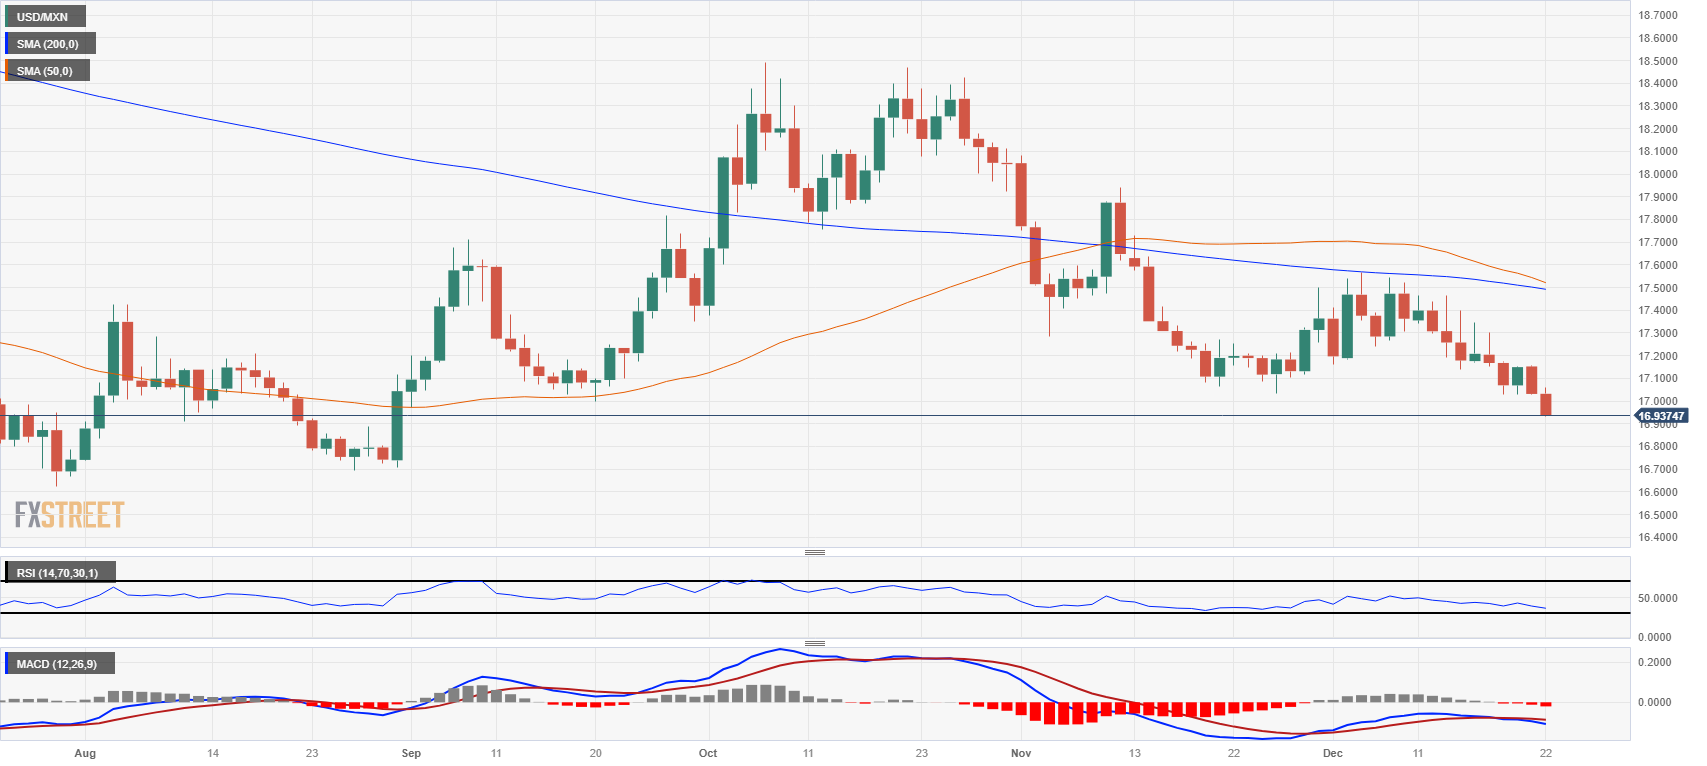
Daily candlesticks show the USD/MXN accelerating into multi-month lows as the pair drops through 17.00. Meanwhile, the 50-day and 200-day SMAs are set for a bearish crossover, which will chalk in a heavy technical resistance zone to cap off any bullish recoveries heading into 2024.
USD/MXN Hourly Chart
USD/MXN Daily Chart
Inflation FAQs
Inflation measures the rise in the price of a representative basket of goods and services. Headline inflation is usually expressed as a percentage change on a month-on-month (MoM) and year-on-year (YoY) basis. Core inflation excludes more volatile elements such as food and fuel which can fluctuate because of geopolitical and seasonal factors. Core inflation is the figure economists focus on and is the level targeted by central banks, which are mandated to keep inflation at a manageable level, usually around 2%.
The Consumer Price Index (CPI) measures the change in prices of a basket of goods and services over a period of time. It is usually expressed as a percentage change on a month-on-month (MoM) and year-on-year (YoY) basis. Core CPI is the figure targeted by central banks as it excludes volatile food and fuel inputs. When Core CPI rises above 2% it usually results in higher interest rates and vice versa when it falls below 2%. Since higher interest rates are positive for a currency, higher inflation usually results in a stronger currency. The opposite is true when inflation falls.
Although it may seem counter-intuitive, high inflation in a country pushes up the value of its currency and vice versa for lower inflation. This is because the central bank will normally raise interest rates to combat the higher inflation, which attract more global capital inflows from investors looking for a lucrative place to park their money.
Formerly, Gold was the asset investors turned to in times of high inflation because it preserved its value, and whilst investors will often still buy Gold for its safe-haven properties in times of extreme market turmoil, this is not the case most of the time. This is because when inflation is high, central banks will put up interest rates to combat it.
Higher interest rates are negative for Gold because they increase the opportunity-cost of holding Gold vis-a-vis an interest-bearing asset or placing the money in a cash deposit account. On the flipside, lower inflation tends to be positive for Gold as it brings interest rates down, making the bright metal a more viable investment alternative.