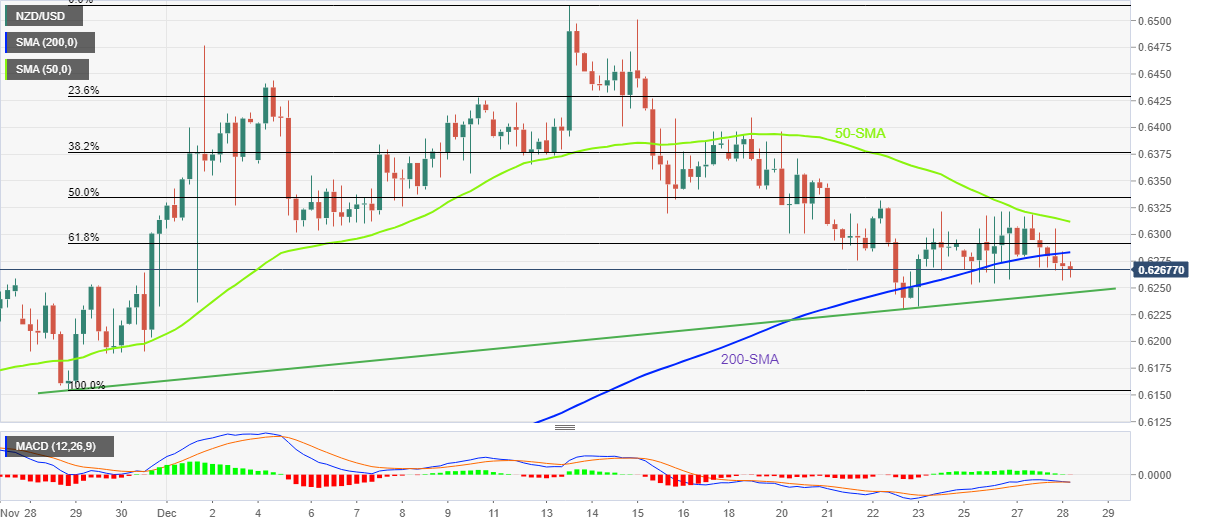
- NZD/USD holds lower ground near intraday bottom, extends pullback from 50-SMA.
- Failure to stay beyond 200-SMA, looming bear cross on MACD favor sellers.
- One-month-old ascending trend line restricts immediate downside.
- 61.8% Fibonacci retracement adds to the upside filters.
NZD/USD prints mild losses around 0.6260 as it drops for the second consecutive day heading into Wednesday’s European session.
In doing so, the Kiwi pair not only extends pullback from the 50-SMA but also marks one more downside move below the 200-SMA.
The downside moves also take clues from the impending bear cross on the MACD indicator, as well as the lower high formation marked since December 13.
That said, an upward-sloping support line from November 28, close to 0.6245, holds the key for the NZD/USD pair’s further downside.
Also acting as the short-term key support is the monthly low near 0.6230, quickly followed by late November’s swing low surrounding 0.6290.
Meanwhile, the 61.8% Fibonacci retracement level of the NZD/USD pair’s November 28 to December 13 upside, also known as the “Golden Ratio”, guards immediate recovery moves of the pair around 0.6290, in addition to the 200-SMA hurdle of 0.6283.
During the quote’s run-up beyond 0.6290, the 0.6300 round figure and the 50-SMA resistance of 0.6311 could probe the NZD/USD bulls before giving them control.
Even so, successful trading beyond the 50% Fibonacci retracement level surrounding 0.6335 appears necessary for the Kiwi pair buyers to keep the reins.
NZD/USD: Four-hour chart
Trend: Further downside expected
