- PEPE price rallied 95% between June 20 and 23, pushing it from $0.000000918 to $0.00000178.
- This ascent shattered through many hurdles, but the Wave Trend indicator is now flashing a sell signal.
- Investors can expect the frog-based meme coin to retrace to the $0.00000147 and $0.00000127 support levels.
PEPE price nearly doubled between June 20 and 23, suggesting a massive interest in the meme coin. However, due to the weekend, the volatility has dried up, and indicators are suggesting that the altcoin is ready for a correction.
Also read: Pepe price resumes bullish impetus as PEPE holder count edges toward 20,000
PEPE price ready to take a break
PEPE price was on a steady downtrend between May 13 and June 15, which caused the altcoin to shed 60% of its market value. After creating a local bottom at $0.000000829, the frog-based meme decided to reverse the trend.
Between June 15 and June 23, PEPE price shot up 117%, but this impressive rally picked up steam on June 20 and rallied nearly 95% in just three days. As the PEPE hovers below $0.00000164 resistance levels, investosr need to pay attention to the indicators.
The Relative Strength Index (RSI) is present above the overbought zone, indicating that the altcoin is due for a correction. Likewise, the Awesome Oscillator (AO) indicator has also started producing red histograms that are declining in height, revealing a declining bullish momentum.
The last nail in the bulls’ coffin is the Wave Trend indicator’s bearish crossover above the overbought zone, which indicates that PEPE price is ready for a correction.
The $0.00000147 and $0.00000127 support levels are likely going be tagged after retracing roughly 10% and 20% from the current position of $0.00000162. 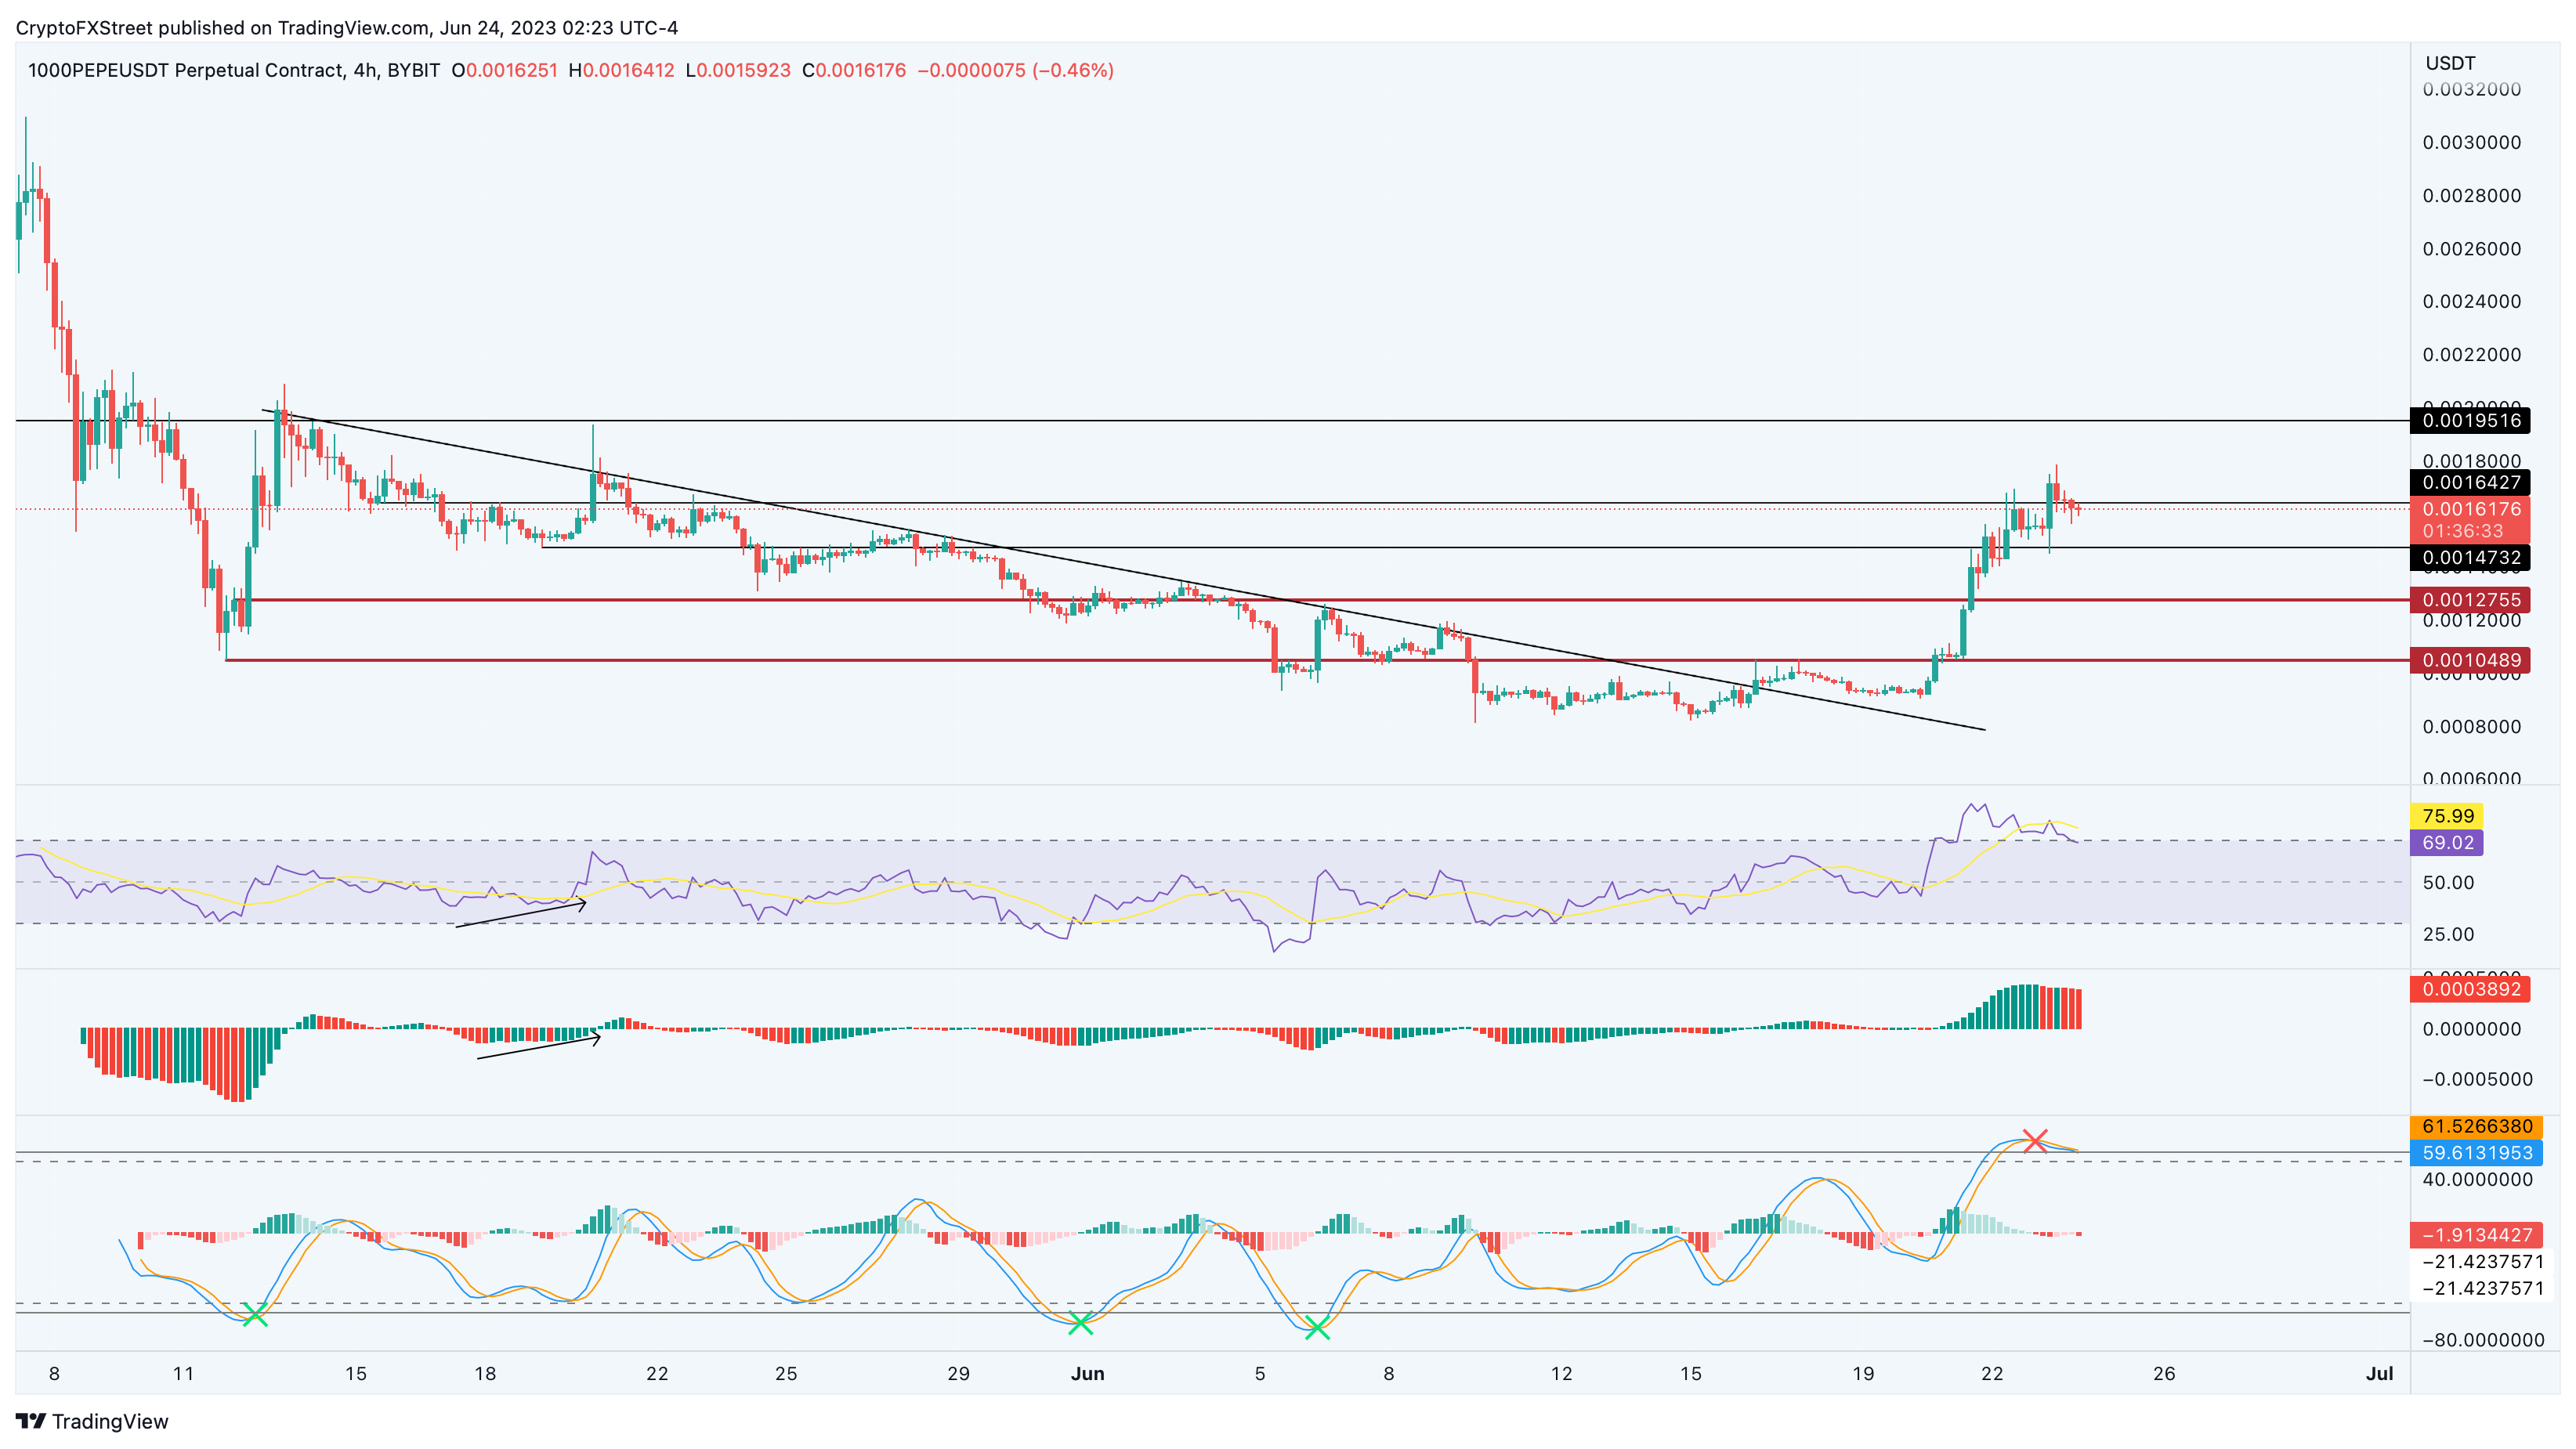
PEPE/USDT 4-hour chart
On the other hand, if PEPE price flips the $0.00000164 hurdle into a support floor while the momentum indicators mentioned above reset, it will invalidate the bearish outlook. In such a case, PEPE price could eye to retest the $0.00000195 resistance level.