- Polkadot price breached the $7.396 level, which has historically proved to be formidable, going back to 2022.
- DOT could drop 10% amid selling pressure due to the aforementioned level, potentially revisiting the $7.000 psychological level.
- The bearish thesis will be invalidated if the altcoin records a daily candlestick close above the $8.074 barrier.
Polkadot (DOT) price is trading with a bullish bias, revisiting levels last tested in February. Despite the bulls showing strength, a correction may be underway as DOT is revisiting levels it has faced strong rejection in the past.
Also Read: Polkadot Price Prediction: DOT coils up for a possible 10% pounce
Polkadot price risks a 10% correction
Polkadot price pulled back during the December 22 trading session, as DOT was overbought, evidenced by the position of the Relative Strength Index (RSI) above the 70 level.
If selling pressure increases, Polkadot price could extend the fall, dipping into the supply zone that now acts as a bullish breaker between $7.236 and $7.575. A break and close below the midline of this order block at $7.396 would confirm the continuation of the downtrend.
Such a move could send Polkadot price lower to revisit the $6.240 level. Such a move would constitute a 22% drop below current levels.
Notably, the RSI is moving south, showing that momentum is dropping. This favors the bearish thesis.
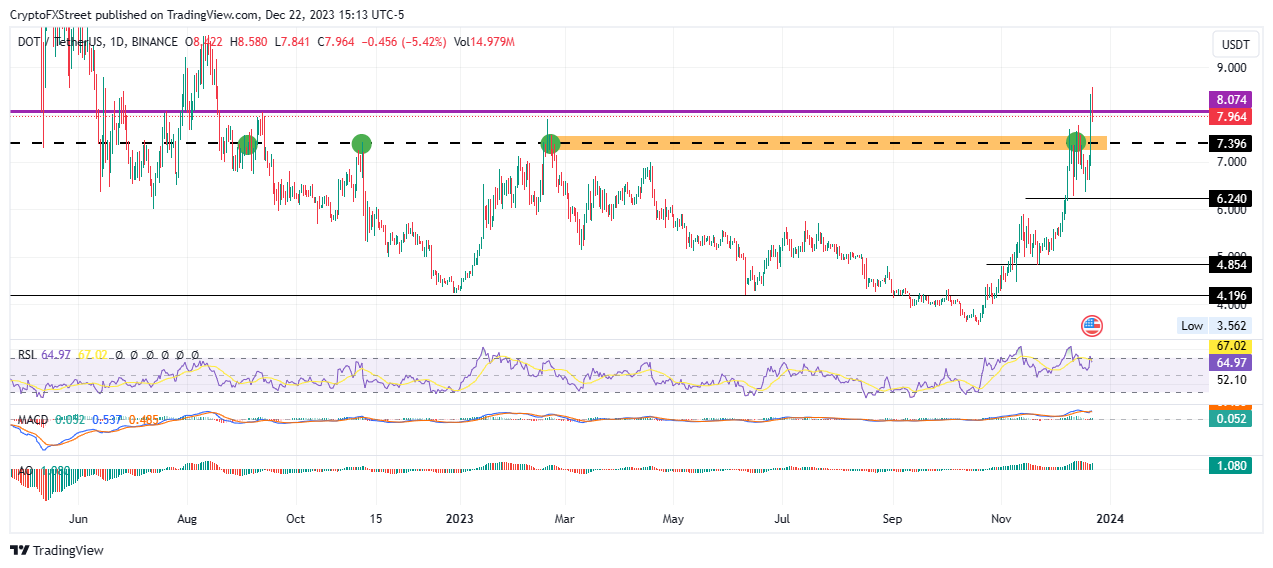
DOT/USDT 1-day chart
On the other hand, if sidelined investors come in, Polkadot price could push north, reclaiming above the $8.074 level and flipping it back into a support. In a highly bullish case. The gains could extend for DOT market value to tag the $9.000 psychological level.
Both the Awesome Oscillator (AO) and the Moving Average Convergence Divergence (MACD) indicators support the bullish thesis, moving in the positive territory to show the bulls have the upper hand.
Source