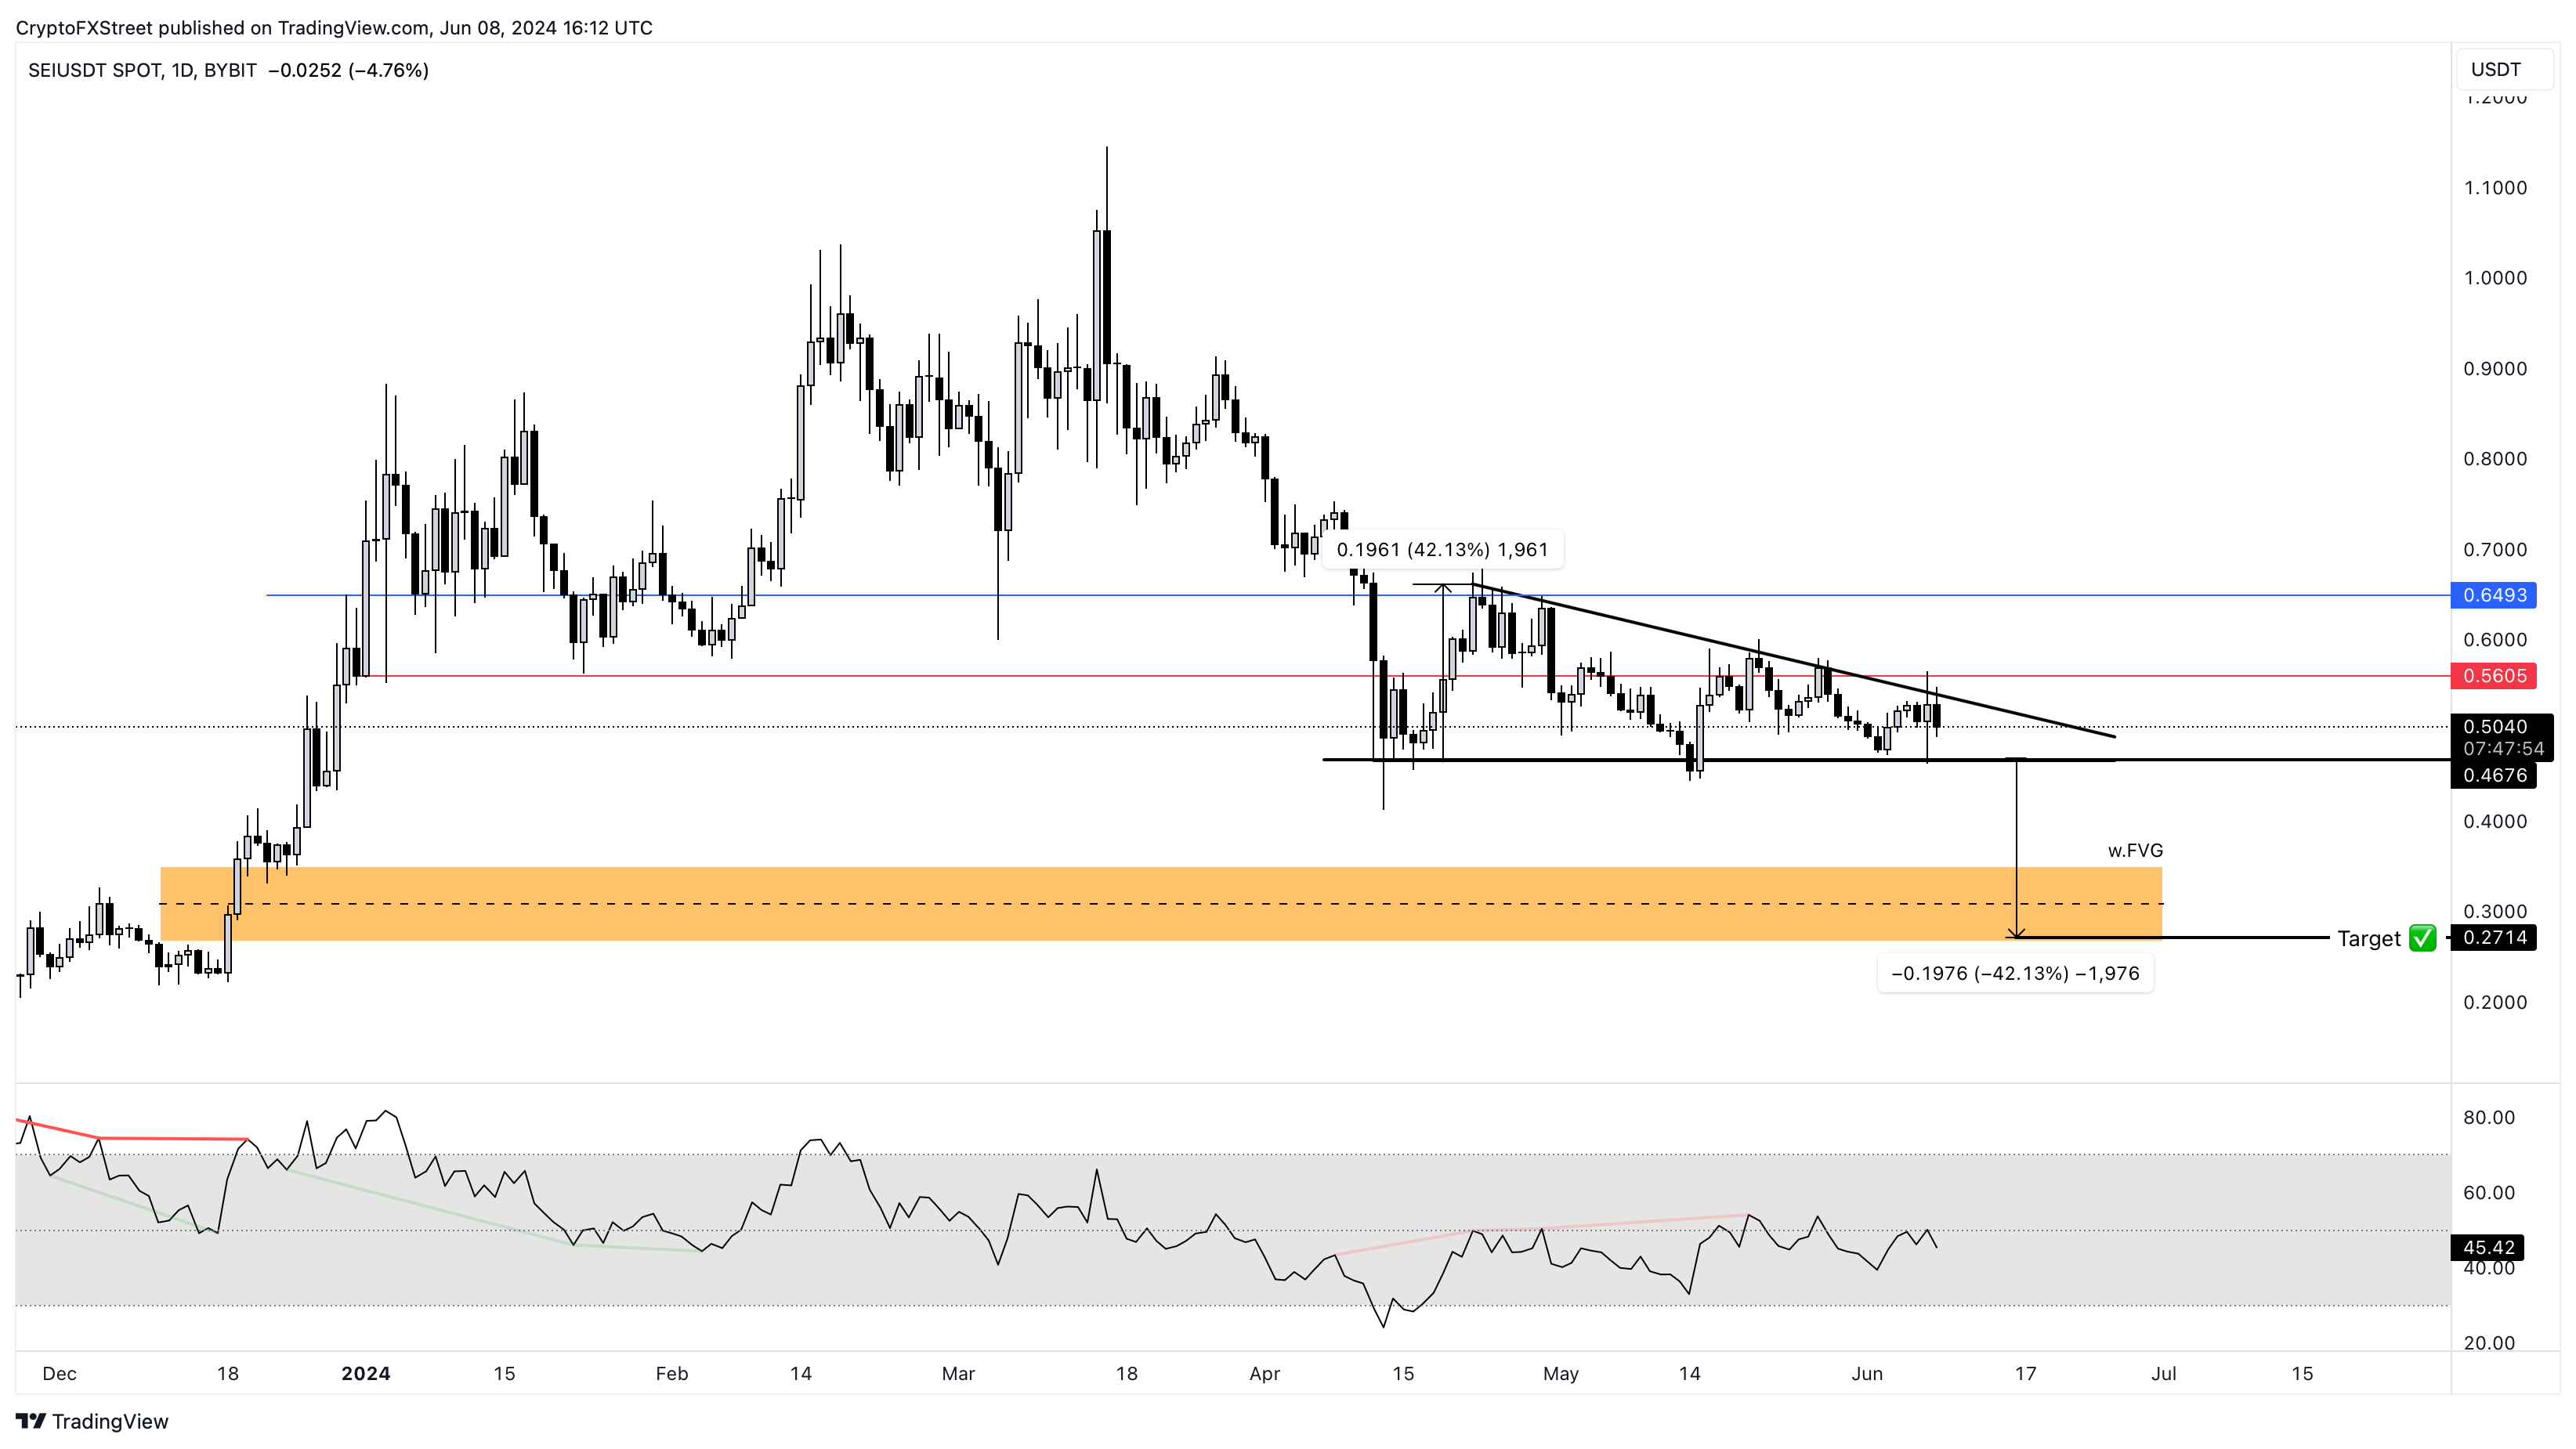
- Sei price is consolidating in a descending triangle pattern.
- A breakout from this setup forecasts a 40% crash to $0.271.
- A swift flip of $0.560 hurdle into support will invalidate the bearish thesis.
Sei (SEI) price consolidation is nearing its end, which could soon result in a volatile breakout. SEI investors need to be cautious, as the crypto market outlook is looking bleak.
Also read: Sei price action forecasts an opportunity to accumulate SEI
SEI price edging closer to a breakout
SEI price action between April 16 and June 8, created five lower highs and three equal highs. Connecting these swing points using trend lines shows the formation of a descending triangle setup. This bearish pattern forecasts a 42% crash, obtained by adding the distance between the first swing high and swing low to the breakout point of $0.467.
The forecasted target sits at the lower limit of the weekly imbalance, extending from $0.350 to $0.265. The confluence of the theoretical target coupled with the weekly imbalance makes it a good level for accumulation.
The Relative Strength Index (RSI) has been struggling below the mean level of 50, suggesting that bulls are not banded together. If this outlook continues, then the theoretical forecast could come into play.
SEI/USDT 1-day chart
While the general market outlook is bearish, if Bitcoin (BTC) price shoots up, it could ruin this bearish outlook. In such a case, if SEI price produces a decisive daily candlestick close above $0.560, it would create a higher high and invalidate the bullish thesis.
This development could further see SEI price attempt a retest of the $0.649 hurdle after a 16% move.
Source
