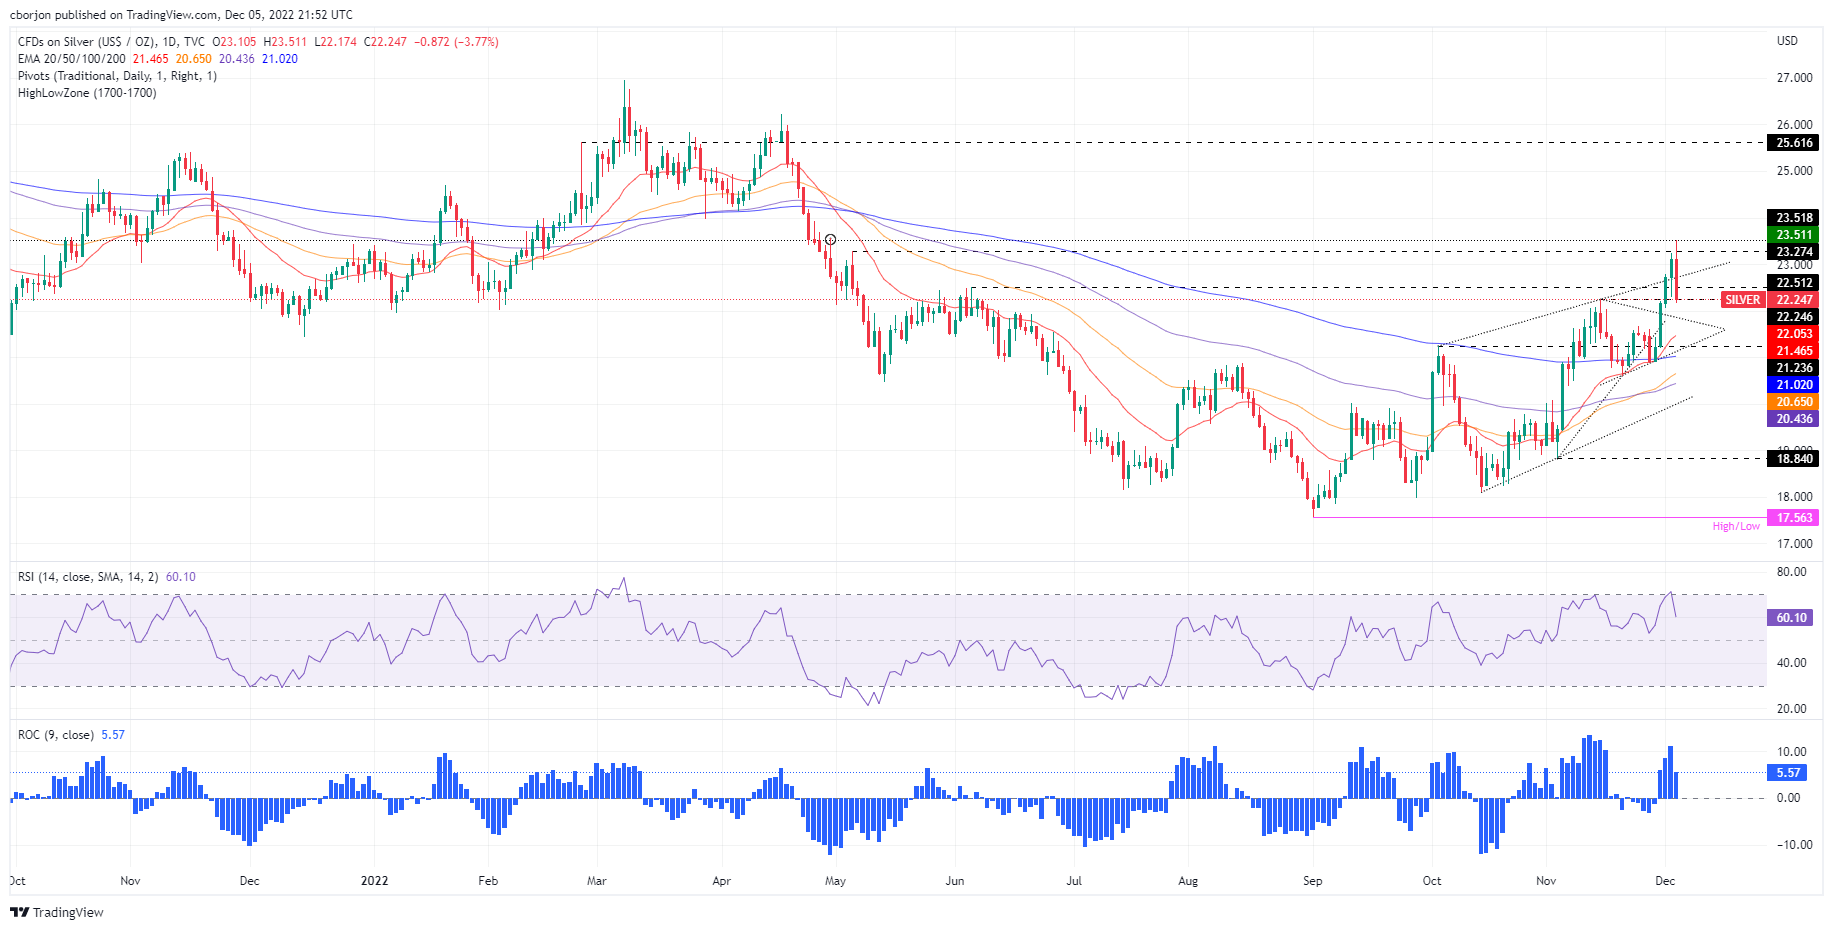
- Silver price plunges 3.74%, on high US Treasury yields, back below $22.30.
- Silver Price Analysis: A daily close below $22.24 would exacerbate a fall further; otherwise, a re-test of $23.00 is possible.
Silver price collapsed from around $23.51 daily high down to $22.23, spurred by high US Treasury yields caused by upbeat US economic data justifying the Federal Reserve’s (Fed) need to continue increasing borrowing costs. Therefore, the XAG/USD drops 3.90%, trading at $22.25.
Silver Price Analysis: XAG/USD Technical Outlook
The XAG/USD daily chart portrays the white metal as upward biased, despite falling from multi-month highs. Should be noted that XAG/USD is testing the November 15 daily high of 22.24, which, once cleared, would exacerbate a deeper correction toward the $22.00 psychological mark, followed by the 200-day Exponential Moving Average (EMA) at $21.02.
The Relative Strength Index (RSI) exited from overbought conditions, triggering a sell signal that caused Monday’s dive, while the Rate of Change (RoC) depicts buyers losing momentum.
Therefore, the XAG/USD might be headed for a pullback. However, if XAG/USD holds its reins above $22.24, that could open the door for consolidation. Hence, the XAG/USD first resistance would be the $22.50 mark, followed by the $23.00 figure. Break above will expose the multi-month high of $23.50.
