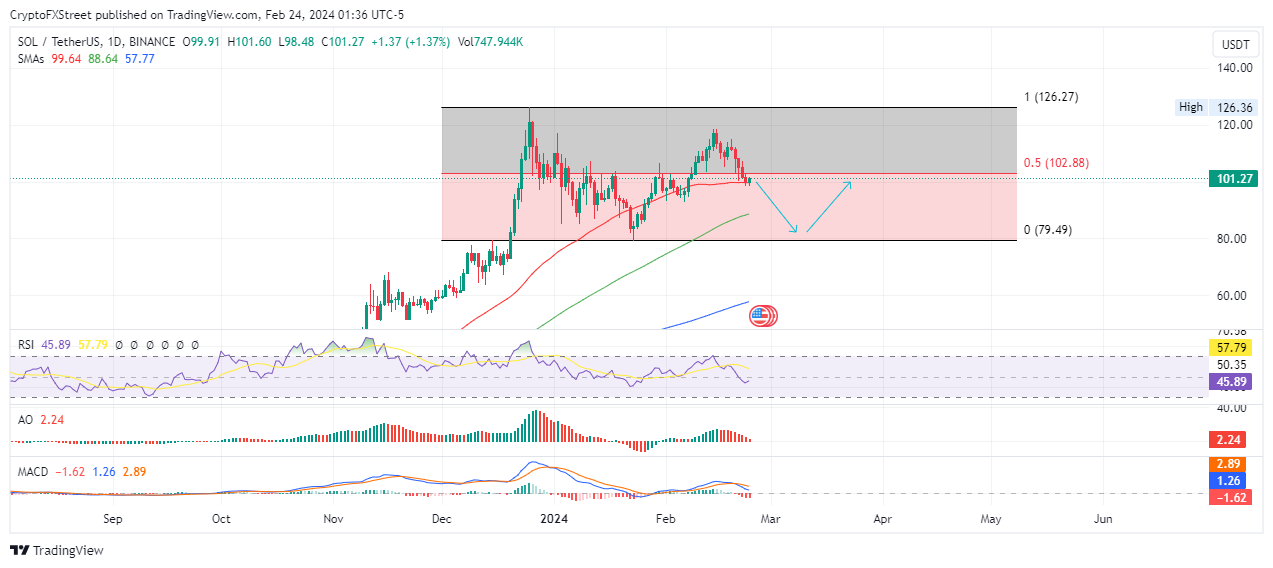
- Solana price remains below the midline of the market range with the bears showing strength
- SOL could drop 20%, revisiting the January 23 lows before the next leg up .
- The bearish thesis will be invalidated if the price breaks and closes above the 50% Fibonacci level of $102.88.
Solana (SOL) price is trading with a bearish bias, recording a series of lower highs and lower lows since mid-February. The downtrend has seen the Layer 1 (L1) token drop below the midline of the market range between $79.49 and $126.27.
Solana price could drop all the way to the low
Solana (SOL) price is sitting on support due to the 50-day Simple Moving Average (SMA) at $99.64. If this support level gives in, SOL could drop to the 100-day SMA at $88.64, or worse, extend a leg down to the bottom of the market range at $79.49.
The Relative Strength Index (RSI) is below the 50% midline, pointing to a low price strength. The Moving Average Convergence Divergence (MACD) is also below its signal line, suggesting a bearish cycle. Also, its histogram bars are below the 50 midline, flashing red to show the bears dominance in the SOL market.
The bearish thesis is also accentuated by the Awesome Oscillator (AO), whose histogram bars are flashing red and edging towards negative territory.
SOL/USDT 1-day chart
Conversely, if the bulls increase their buying pressure, Solana price could push north, flipping $102.88 support into resistance and using it as the jumping off point for extended gains.
Enhanced bier momentum above this level could see SOL market value reclaim the mid-February highs around the $120.00 psychological level, or in a highly bullish case, extend to the peak of the market range at $126.27. Such a move would constitute a 25% climb above current levels.
Source
