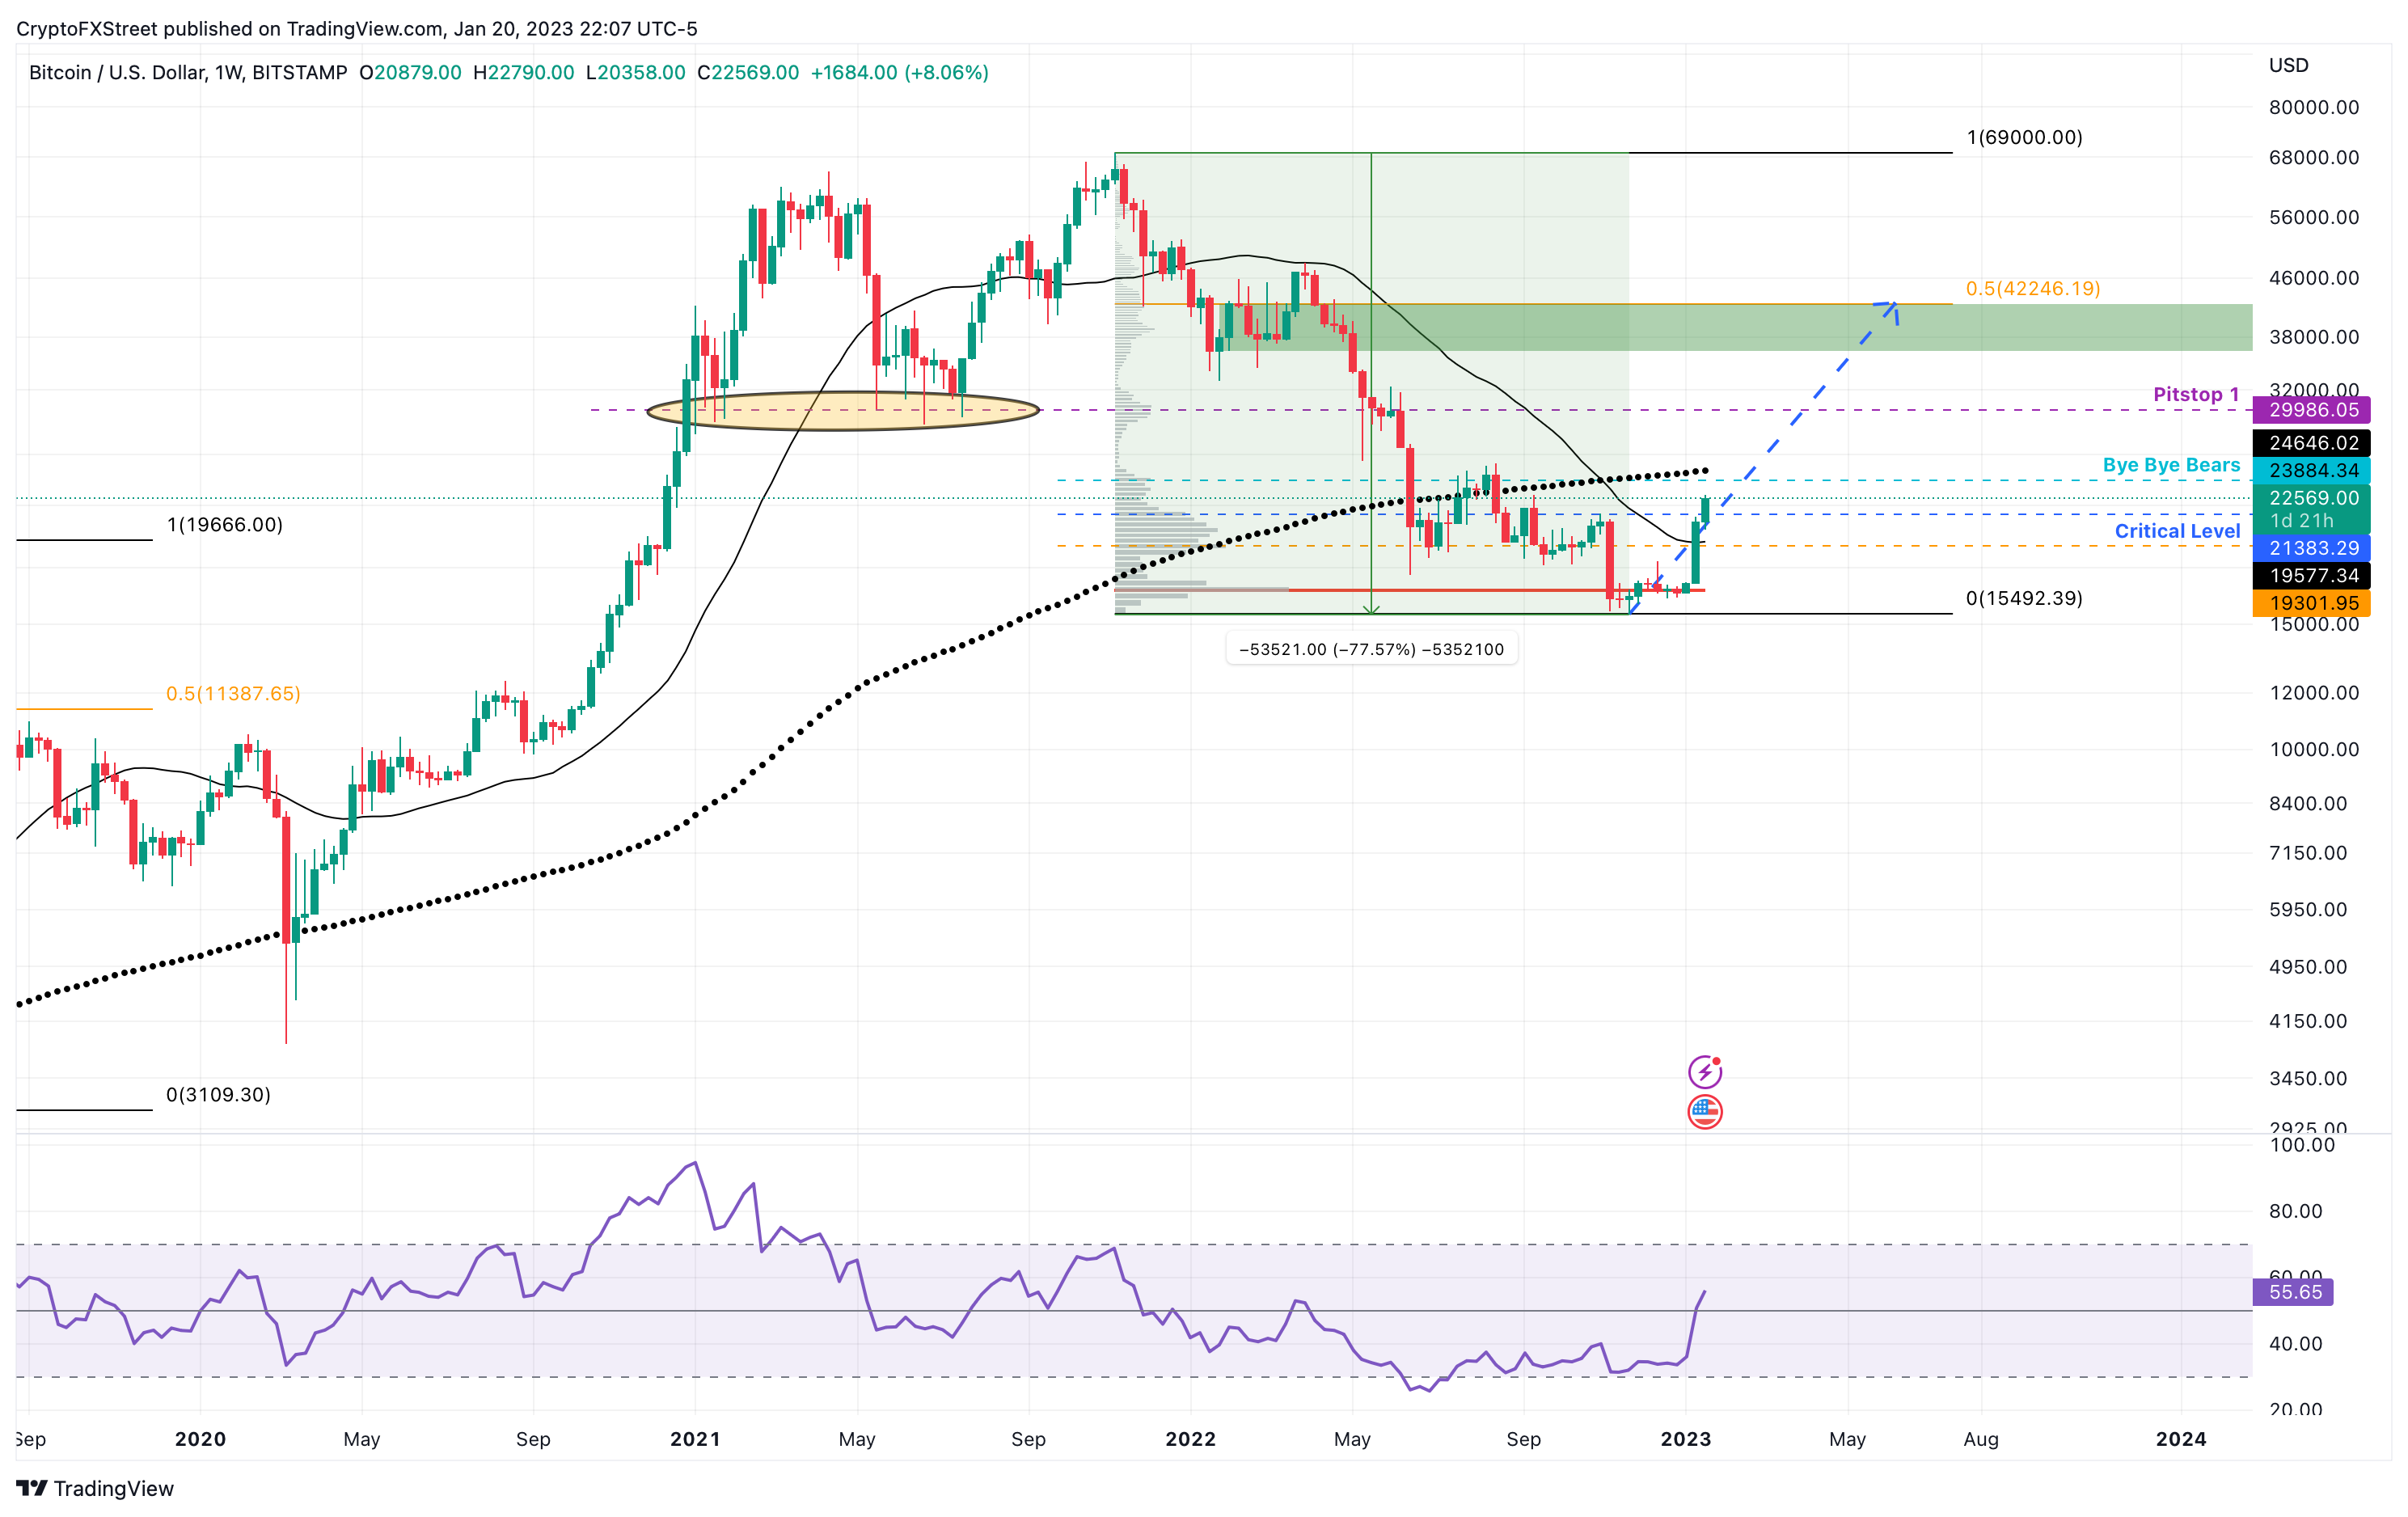
- Bitcoin price has rallied 8% so far after an explosive start to 2023.
- A flip of the 200-weekly SMA at $24,646 will open the path for BTC to retest $30,000.
- Invalidation of the bullish thesis will occur if BTC flips the $15,443 support level.
Bitcoin price has begun its ascent after a steep bear market correction. This massive upswing began after a fresh start to 2023, but things could get interesting if BTC can flip a certain level into a support floor.
Also Read: Bitcoin Weekly Forecast: Assessing shift in BTC’s narrative and critical levels to watch
Bitcoin price oozes bullishness
Bitcoin price has shed 77% from its all-time high of $69,000. This downtrend was a result of investors booking profits combined with the collapse of key players in the industry in a feedback loop.
Each move kept adding more pressure to the industry participants, causing them to crumble and file for bankruptcy, which added more pressure on the Bitcoin price to slide lower.
Regardless, 2023 had a good start as BTC is up roughly 36% so far, with an 8% rally overnight that has pushed Bitcoin price above a critical hurdle at $21,383. This development now puts the bulls against one major blockade.
This resistance level is a confluence of the horizontal barrier at $23,384 and the 200-week Simple Moving Average (SMA) at $24,645. The last time Bitcoin price slipped below this SMA was in June 2022 and briefly in March 2020.
An interesting observation to make here is that in its 12-year history, Bitcoin has never stayed below this support level for a prolonged duration. Therefore, bulls are likely going to target this hurdle next.
A successful flip of this confluence, especially the $24,645 into a support floor on a weekly timeframe, will open the path for Bitcoin price to retest the $30,000 hurdle.
BTC/USDT 1-week chart
While things are looking up for Bitcoin price, this is the first time in the 12-year history BTC has stayed below the 200-week SMA for more than two weeks. But since the 2022 bear market has pushed the big crypto below this level at $24,645, it is a significant move from a macro perspective that investors need to be cautious about.
Although the bullish outlook seems unfadeable, a rejection at a 200-week SMA at $24,645 will be a crucial sign for bears. A secondary confirmation of the bearish outlook will occur on the breakdown of the $19,301 support level.
A weekly candlestick close, however, below the $15,443 level will create a lower low and invalidate the bullish thesis. In such a case, Bitcoin price could slide as low as $11,387.
