- Bitcoin price is up 5% on the month after hurdling the $17,000 zone.
- Ethereum price outperforms Bitcoin’s gains by 400%.
- XRP price shows resistance during the recenent uptrend move.
The crypto market is feverishly moving north. Time will tell if the current price action is just a countertrend phase or the start of a much larger reversal.
Bitcoin price takes charge
Bitcoin price has made a stunning reversal after weeks of downtrend price action. Since January 1, the peer-to-peer digital currency token has been up 5%, blowing past shortterm resistance barriers and enticing day traders to jump on smaller time frames to join the uptrend hike.
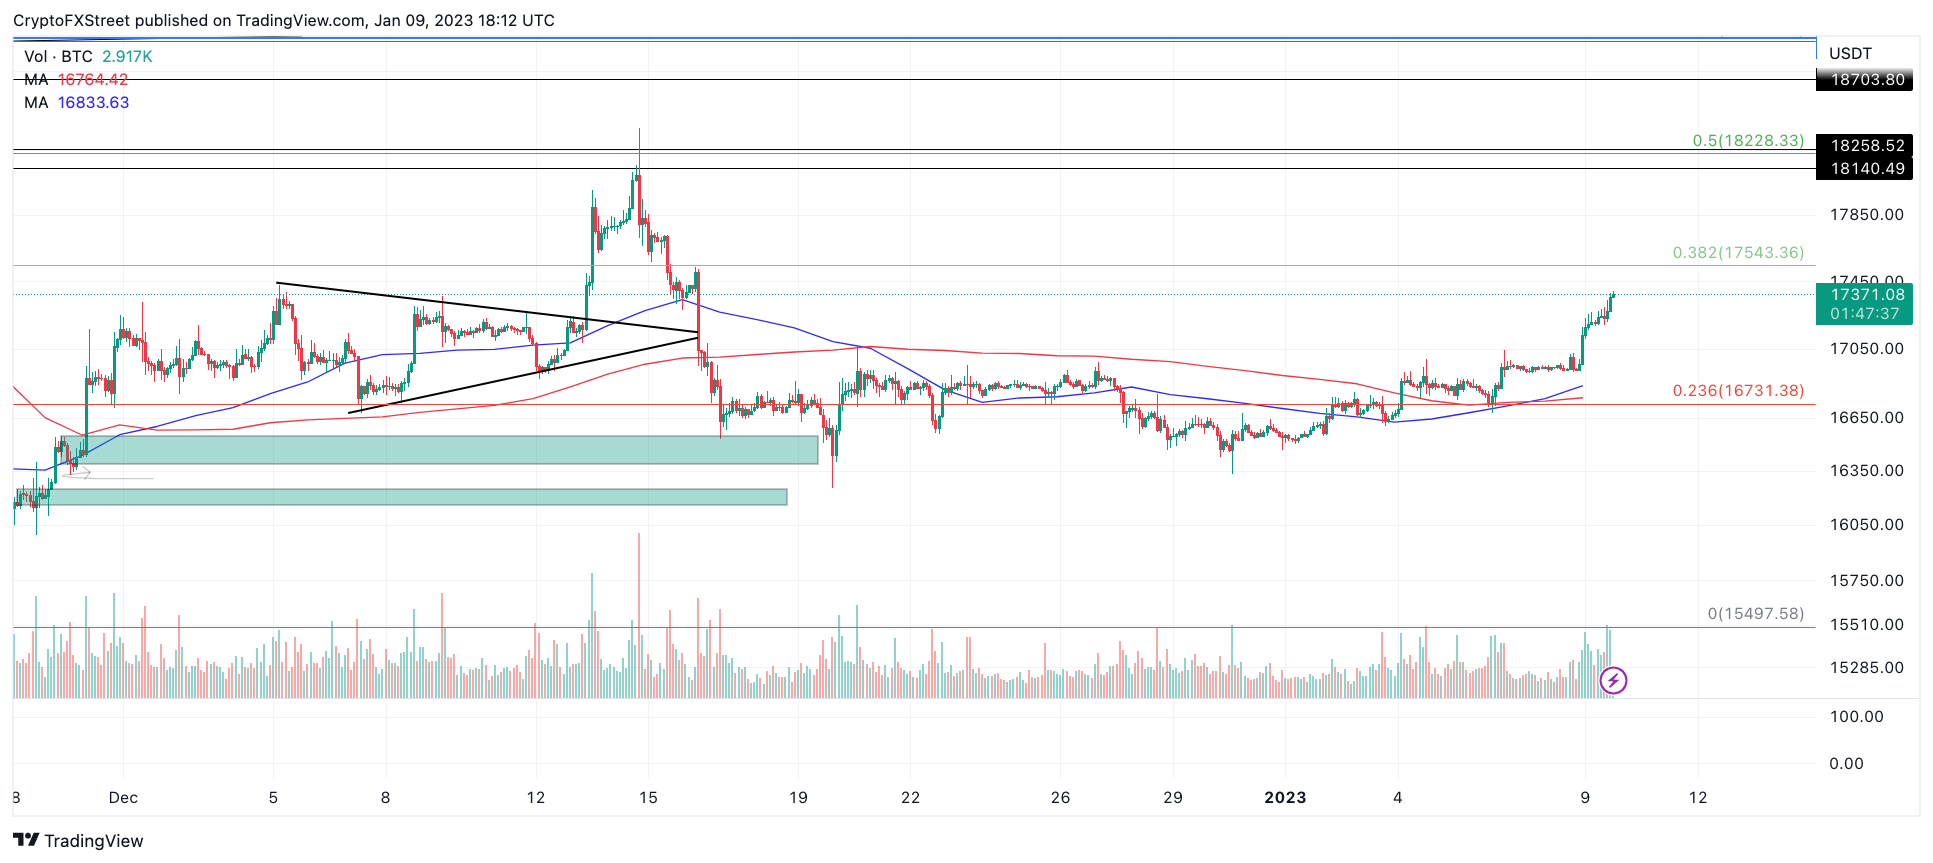
Bitcoin price currently auctions at $17,354, a 1% rise on the day with little resistance from profit-taking bears. The previous outlook mentioned that BTC bulls are likely aiming for December’s monthly high of $18,381. After successfully breaching the 8-day exponential moving average, an indicator used by short-term traders looking to scalp trending markets, the bullish bias is becoming self-fulfilling. A sustained daily candlestick close above the $17,000 barrier will be the final step to confirm the bullish bias for the days to come.
BTC/USDT 1-Day Chart
Now that prices have increased, the bullish thesis’s invalidation can be placed beneath January’s opening price of $16,541. A tag of the monthly marker would give way to a potential sweep-the-lows event targeting the 2022 market low at $15,547, resulting in a 10% drop from Bitcoin’s current market value.
Ethereum price steps up to the plate
Ethereum price has moved in unison with Bitcoin’s bullish surge but has bolstered four times as many gains. On January 9, 2023, the decentralized smart contract token’s market value has increased by 4.5%. On smaller time frames, traders are impulsively entering the market to grab hold of the ETH’s profiting-yielding horns.
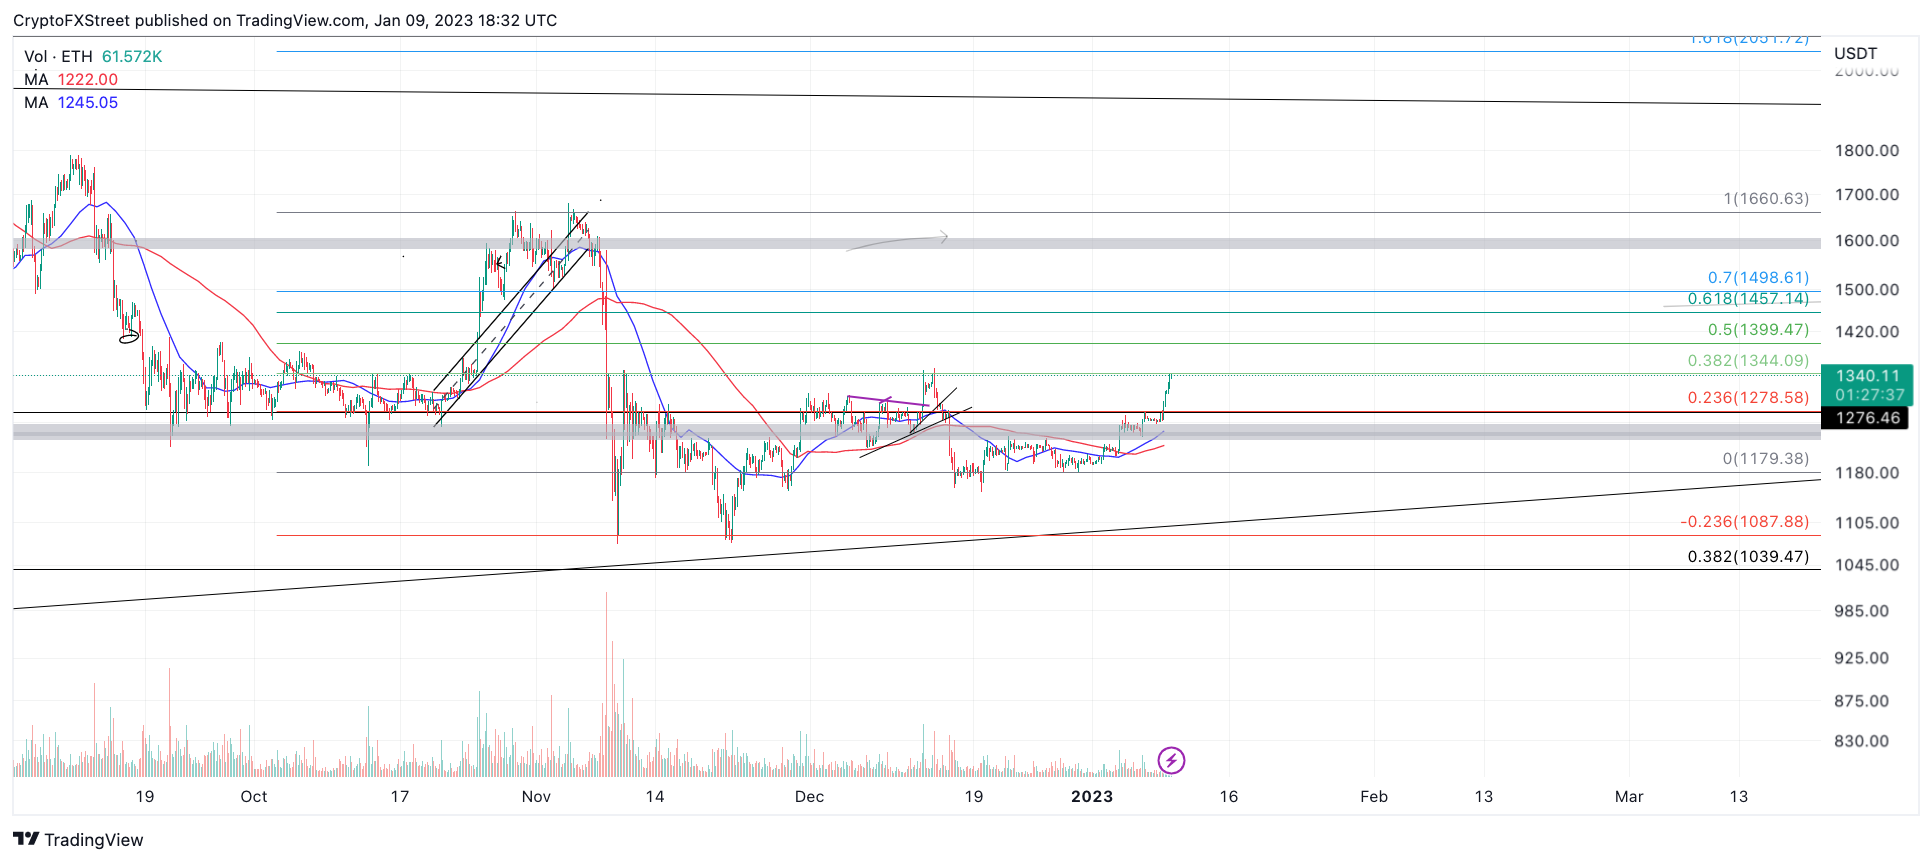
Ethereum price currently trades at $1,342, perpendicular to the 38.2% Fibonacci retracement level of October’s swing low to swing high. As ETH trade’s within October’s range, the conservative target to aim for is the 61.8% FIb level at $1,457. The bullish scenario creates space for an additional 9% increase in market value from today’s Ethereum price.
ETH/USDT 1-Day Chart
Earliest evidence to suggest an uptrend failure would be a breach below the October range low at $1,328. A tag of the low could induce a liquidation event targeting Autumn’s swing low at $1073, resulting in a 20% decline.
XRP price makes turbulent gains
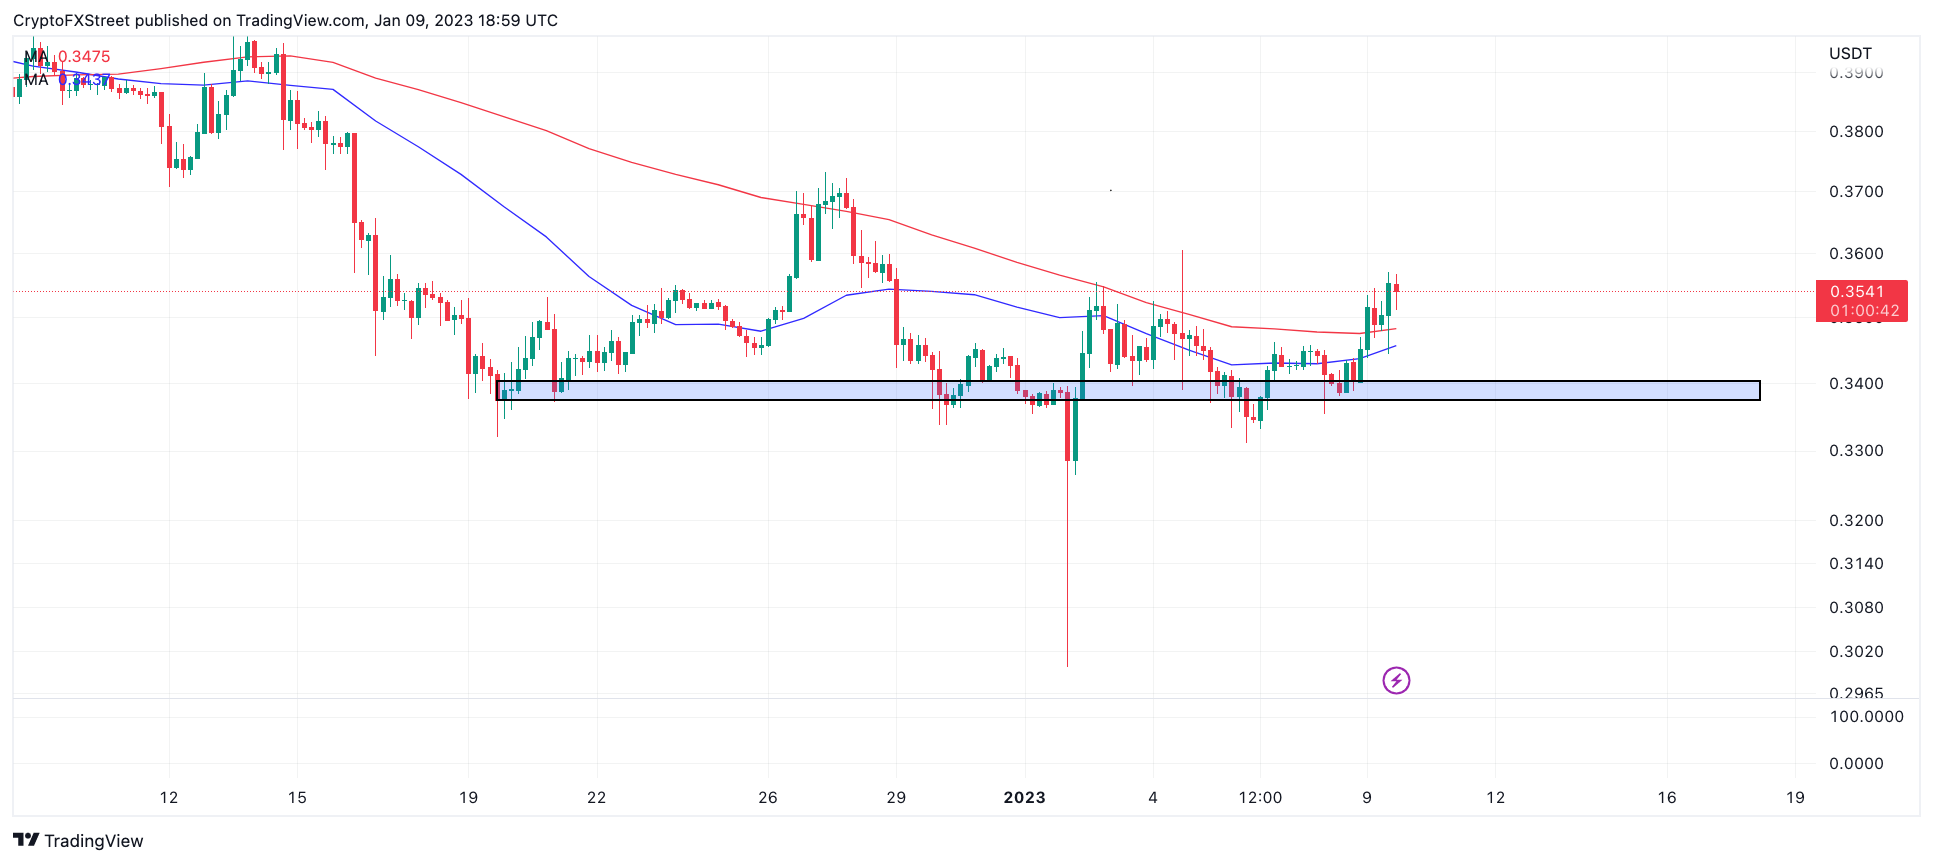
XRP price has risen by 2.5% to start the second trading week of January. When compared to its Ethereum and Bitcoin counterparts, Ripple’s uptrend rise seems more turbulent. The resistance is displayed on the 4-hour chart. Bulls have prompted several attempts to hurdle the $0.35, but profit-taking bears advantageously keep the digital remittance token suppressed.
XRP price currently auctions at $0.353. The ricocheting price action between the converging range enabled a second bearish spike and recovery of the 8-day exponential moving average. If the bulls can sustain a daily close above the aforementioned level, then XRP could continue to make gains in the coming days. A key target to aim for would be the December 27 swing high at $0.373, resulting in a 5% rise from Ripple’s current market value.
XRP/USDT 4-Hour Chart
The health of the uptrend demands that the swing low beneath the recent liquidation beneath $0.344 remains untagged. A tag of the low could induce a second bearish attempt into December’s range low targeting $0.33, resulting in a 5% decline.


