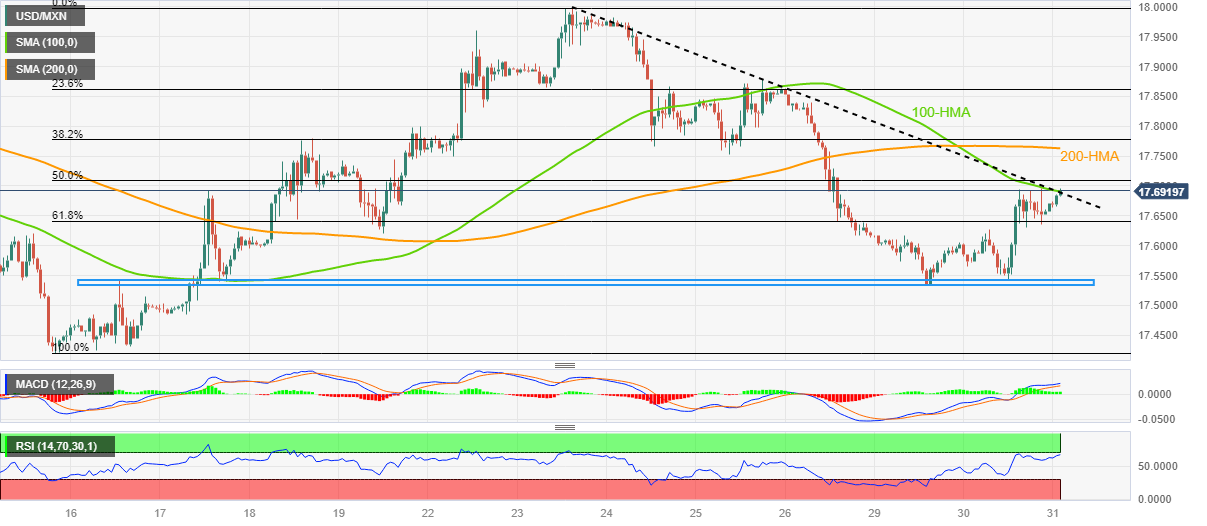
- USD/MXN picks up bids to extend previous recovery from fortnight low.
- Convergence of 100-HMA, one-week-old descending trend line prod pair buyers.
- 200-HMA acts as additional hurdle for Mexican Peso sellers.
- Two-week-old horizontal support is the key for pair bears to conquer.
USD/MXN holds onto the previous day’s recovery from a two-week low as bulls poke a 17.69 resistance confluence during early Wednesday.
In doing so, the Mexican Peso (MXN) pair struggles to extend recovery from a fortnight-long horizontal support while jostling with the short-term key upside hurdle comprising the 100-Hour Moving Average (HMA) and a one-week-old descending trend line.
It’s worth noting that the overbought RSI (14) conditions challenge the USD/MXN buyers around the 17.69 resistance confluence.
Even if the quote crosses the 17.69 key resistance, the 17.70 round figure and the 200-HMA level of 17.76 may act as extra filters toward the north ahead of directing the pair buyers toward the monthly peak of near the 18.00 round figure.
Alternatively, the USD/MXN pair’s pullback remains elusive unless the quote stays beyond the 61.8% Fibonacci retracement level of May 15-23 upside, near 17.64 at the latest.
Should the quote drops below 17.64, it can drop to the aforementioned two-week-old horizontal support zone surrounding 17.54-53.
The USD/MXN pair’s south-run towards the multi-month low marked earlier in May around 17.42 and the year 2016 low of near 17.05 can’t be ruled out.
USD/MXN: Hourly chart
Trend: Limited upside expected
