Ripple (XRP) is coming under intense selling pressure, trading around $1.40 on Monday. The remittance token appears to lack the required tailwind to sustain its recovery, while broader crypto market headwinds weigh on price action.
A daily close above $1.40 could encourage buyers to take on more risk. However, it is too early to rule out another sharp decline below the same level, which could further weaken XRP’s technical outlook.
Standard Chartered adds RLUSD custody support
Standard Chartered Bank has reportedly launched institutional custody for RippleUSD (RLUSD), Ripple’s $2.4 billion stablecoin on the XRP Ledger (XRPL). A report published by The Block confirmed that RLUSD was live and accessible through Standard Chartered’s Dubai International Financial Center (DIFC) branch. The product, which expands the bank’s crypto-related services, is regulated by the Dubai Financial Services Authority.
Ripple, LMAX Group and Standard Chartered are also collaborating to enable the stablecoin to be used as eligible collateral for specific services LMAX offers. This development would allow RLUSD assets to be mirrored to LMAX Group for collateral purposes without moving the underlying asset to the trading platform. However, the RLUSD collateral product remains under review pending final documentation, testing, regulatory and internal approvals.
Standard Chartered’s Global Head of Digital Assets, Waqar Chaudry, said that integrating RLUSD would enable eligible institutional clients “to participate in digital asset markets without compromising on how their assets are safeguarded or how risk is managed. The ecosystem must therefore make it easier for clients to hold assets securely, access liquidity and deploy collateral efficiently within trusted frameworks.”
Technical analysis: XRP consolidates as support holds
XRP trades above $1.40, maintaining a constructive near-term bias as price holds above a dense layer of moving-average support. The pair sits above the 50-day Exponential Moving Average (EMA) at $1.40, while the 200-day EMA at $1.38 and the 100-day EMA at $1.34 sit further below and reinforce the broader bullish structure.
The SuperTrend indicator at $1.30 underpins the medium-term uptrend, though a soft Relative Strength Index (RSI) around 45 and a negative Moving Average Convergence Divergence (MACD) line suggest upside momentum is subdued despite the supportive backdrop.
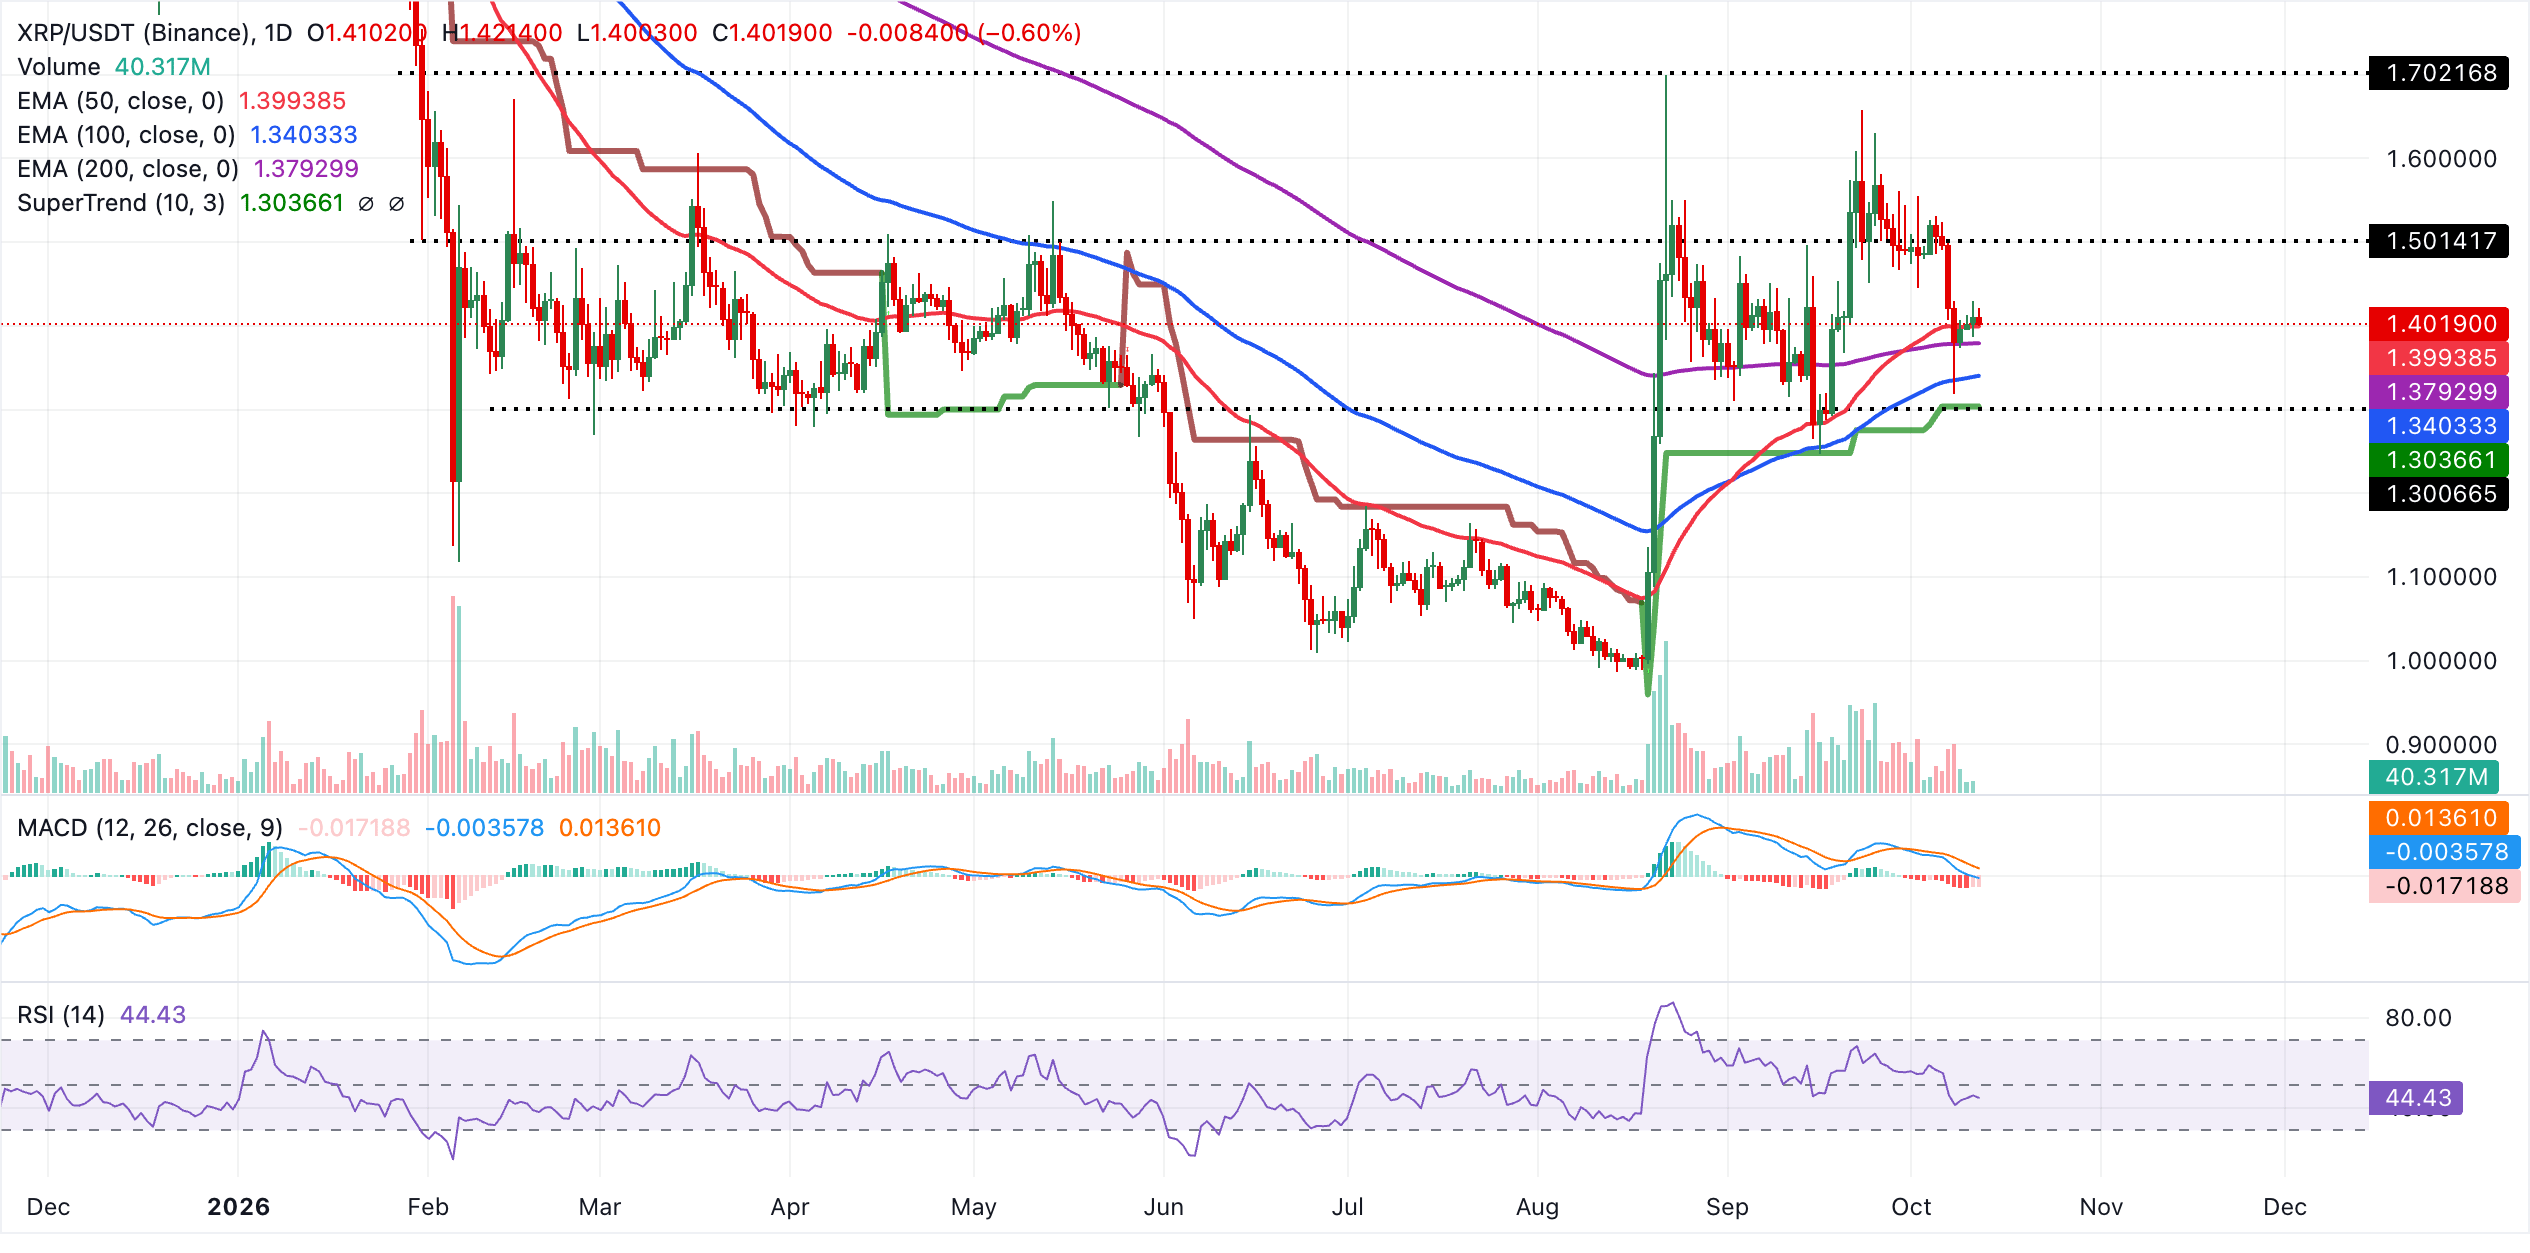
Initial support lies at the 50-day EMA near $1.40, with the 200-day EMA at $1.38 acting as the next cushion if sellers press lower. A deeper pullback would expose the 100-day EMA at $1.34 ahead of the SuperTrend line around $1.30, where buyers would be expected to defend the broader bullish trend.
(The technical analysis of this story was written with the help of an AI tool. Know more.)