- Pi Network faces increasing overhead pressure as it struggles to avoid a drop below $0.40, close to its all-time low.
- Around 160 million PI tokens will be unlocked in August, increasing the circulating supply by 2.1%.
- The price fails to find support as the Pi Network on-ramp service, allowing users to buy PI directly, is delayed.
Pi Network (PI) loses steam on Thursday, trading below $0.4200 at the time of writing, falling from a daily high of $0.4364 earlier in the day. The bearish grip on PI, which has been on a clear downtrend since mid-May, tightens ahead of the 160 million token unlock in August and the delay in PI integration by Onramp Money, tilting the technical outlook bearish.
Monthly token unlock in August risks increased selling pressure
PiScan data indicates that 161.6 million PI tokens will be unlocked in August, increasing the circulating supply by 2.09%. This monthly unlock is the largest until December, when 170.5 million PI tokens will be released into circulation.
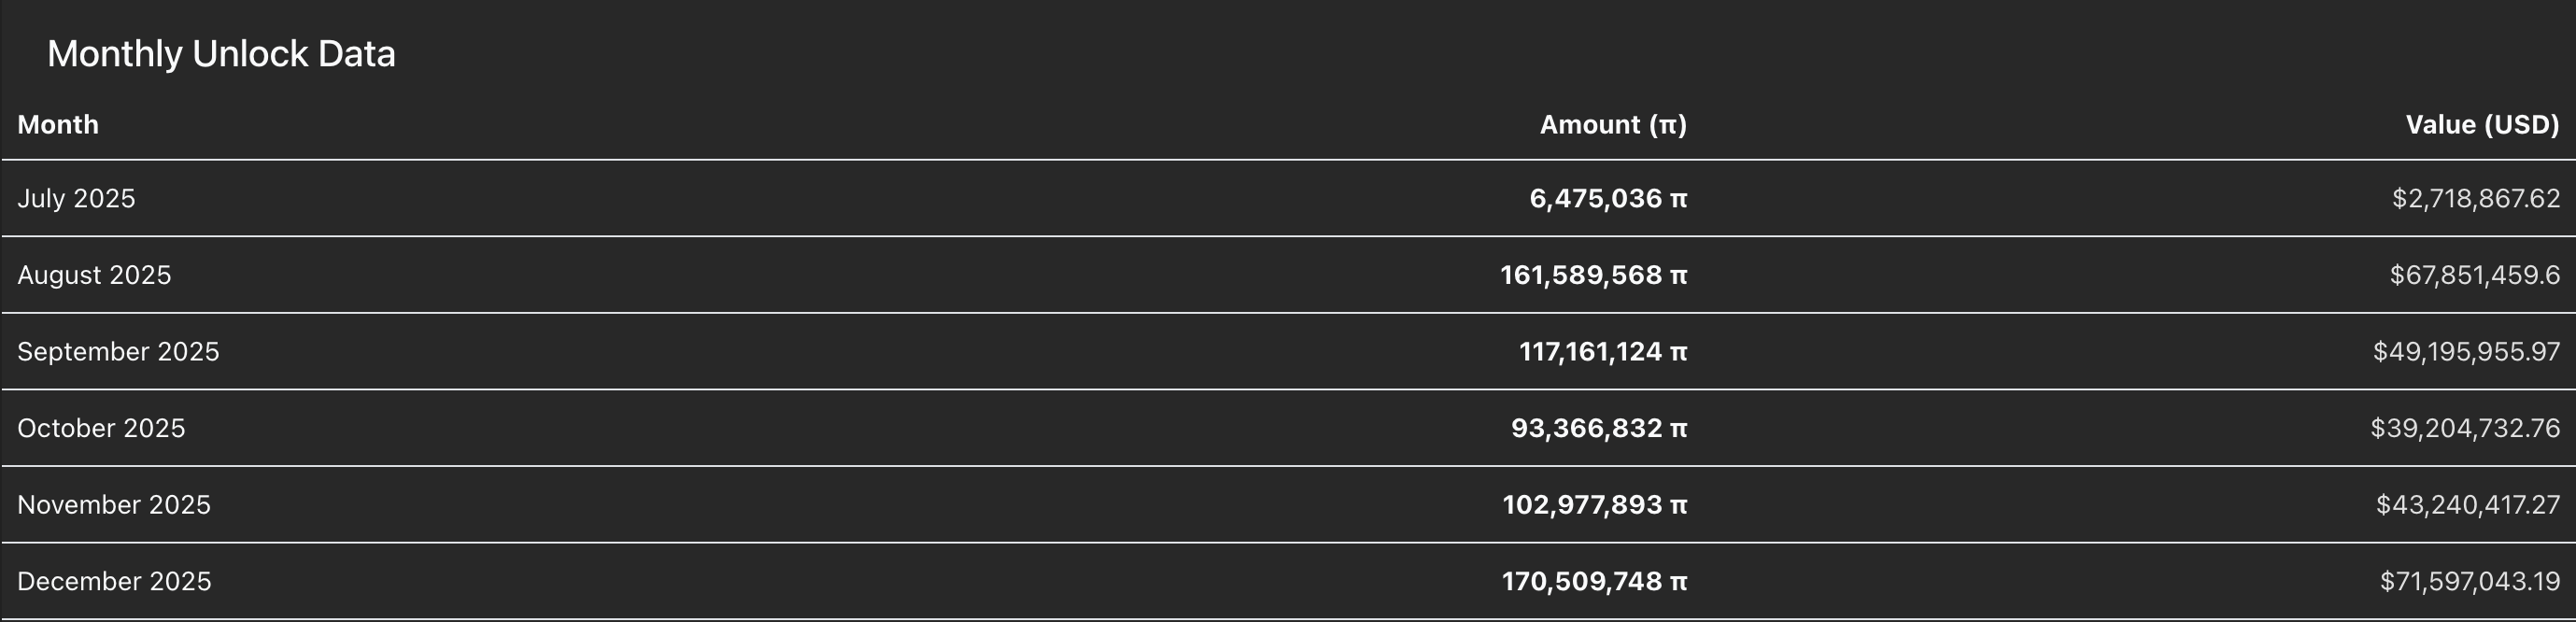
PI token unlock data. Source: PiScan
Sidelined investors expecting a reversal in PI should temper their bullish expectations, as unlock events tend to increase selling pressure, allowing investors to book profits.
Onramp Money delays official integration of PI
Onramp Money announced on Tuesday that the PI integration is still in progress. The on-ramping company will allow users to buy PI tokens directly in exchange for fiat currencies, with the official launch expected in the second or third week of August.
Until the official launch announcement on social media handles, the company urges users to avoid making purchases via Onramp Money. As of Thursday, the Pi Network app displays on-ramp alternatives by Banxa and TransFi, although Pi Network has made no official announcement.
PI risks further losses below its $0.4000 crucial support level
Pi Network holds the bearish trend with over 17% decline so far in July. At the time of writing, PI inches closer to its all-time low of $0.4000 last tested on June 13.
The Relative Strength Index (RSI) at 35 on the daily chart holds a declining trend towards the oversold boundary, suggesting a steady decline in buying pressure and signaling prices still have some room to fall. Investors could increase the bearish exposure as the Moving Average Convergence Divergence (MACD) line draws closer to crossing below its signal line. This potential crossover, along with the resurgence of red histograms, would flash a sell signal.
A decisive push below the $0.4000 level could extend the decline to the S1 pivot level at $0.3837, followed by the S2 level at $0.2585.
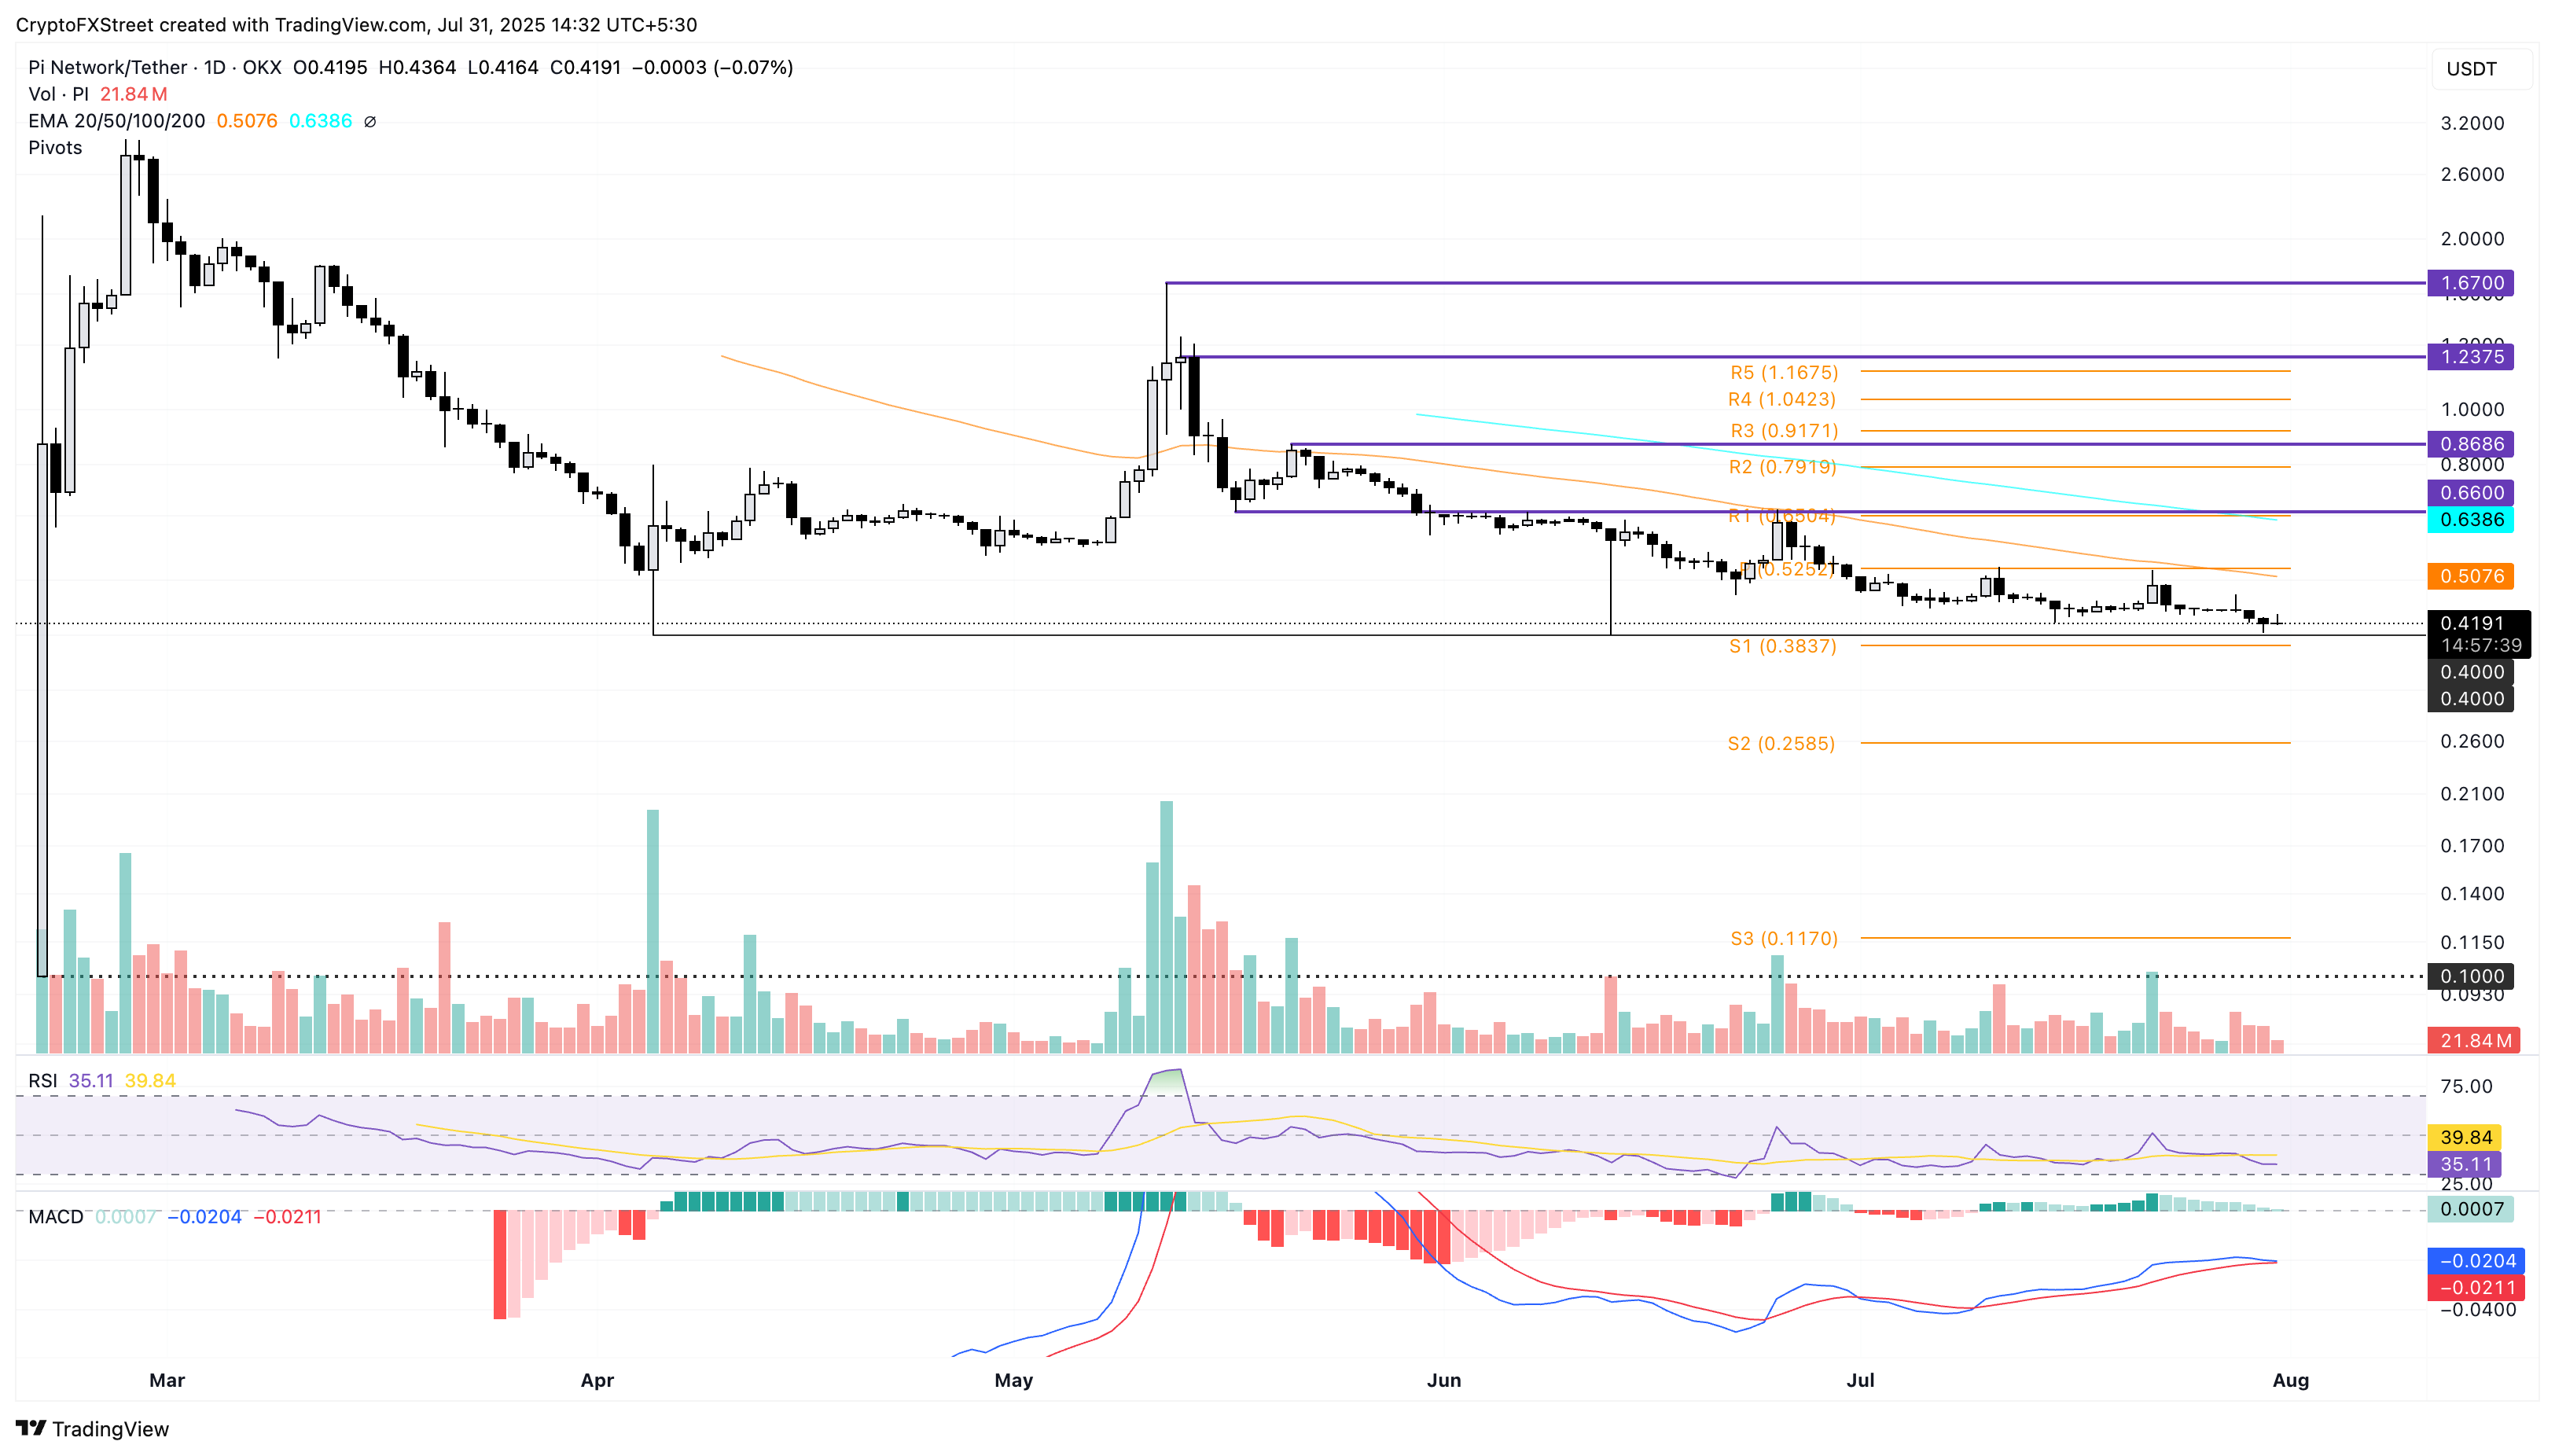
PI/USDT daily price chart.
Looking up, PI should reclaim the $0.5000 psychological level to negate the downtrend.
Cryptocurrency prices FAQs
Source