Gold price (XAU/USD) losses nearly 2% on Thursday as the US Dollar stages a comeback amid growing speculation that the White House may continue its campaign against Iran, which seems poised to prolong the Gulf War. The XAU/USD trades below $4,050 after falling from a two-day high above $4,100
XAU/USD falls as war escalation lifts Dollar and Fed risks
Tensions remain high in the Middle East after N12 reports that the US President Donald Trump is “considering a massive attack greater than anything before, I’m close to making a decision.” Recently, Kann news reported that Israel is awaiting Trump’s decision regarding the significant expansion of military operations in Iran and the possibility of Israel’s involvement in them.
The US Dollar Index (DXY), which tracks the performance of the American currency against the other six, is up 0.29% at 101.43, a headwind for the yellow metal, making it less expensive for foreign buyers.
A scarce US economic docket during the week left traders adrift to Thursday’s Initial Jobless Claims for the week ending July 19, which were better-than-expected, easing from 209K to 187K, below forecasts of 212K. The jobless claims 4-week average dipped from 214.75K to 207.5K. The report justifies the Federal Reserve’s focus on tackling inflation, given the strength of the jobs market.
High Oil prices are also a headwind for the yellow metal, as it is positively correlated with the US Dollar. West Texas Intermediate (WTI), the US crude benchmark, rallies nearly 14%, up to $93.14 per barrel.
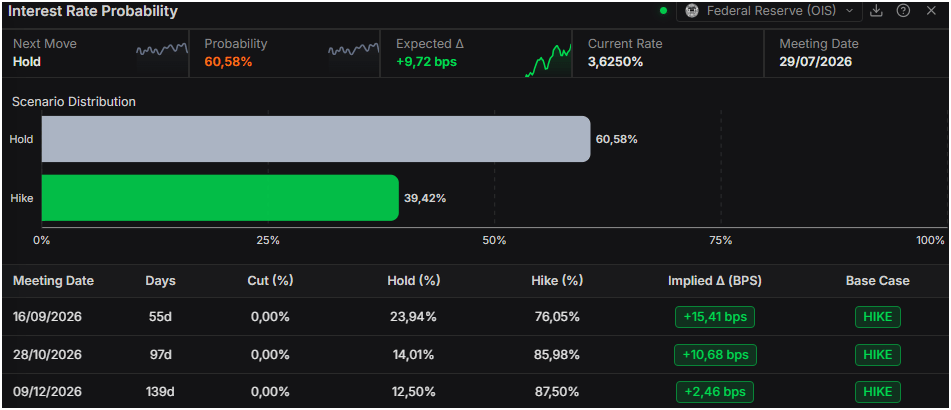
A solid jobs report and higher energy prices prompted investors to increase their bets on a Fed rate hike in 2026. The swaps markets now indicate a higher likelihood of a Federal Reserve rate hike at the July 29 meeting, with probabilities rising from nearly 33% a day ago to close to 40%.
Meanwhile, for the September meeting, the odds are ate 76% for a rate hike, based on Prime Terminal data.
The US economic docket ahead will feature S&P Global Flash PMIs for July and New Home Sales data for June. Next week, the focus will be on the Federal Open Market Committee (FOMC) monetary policy meeting
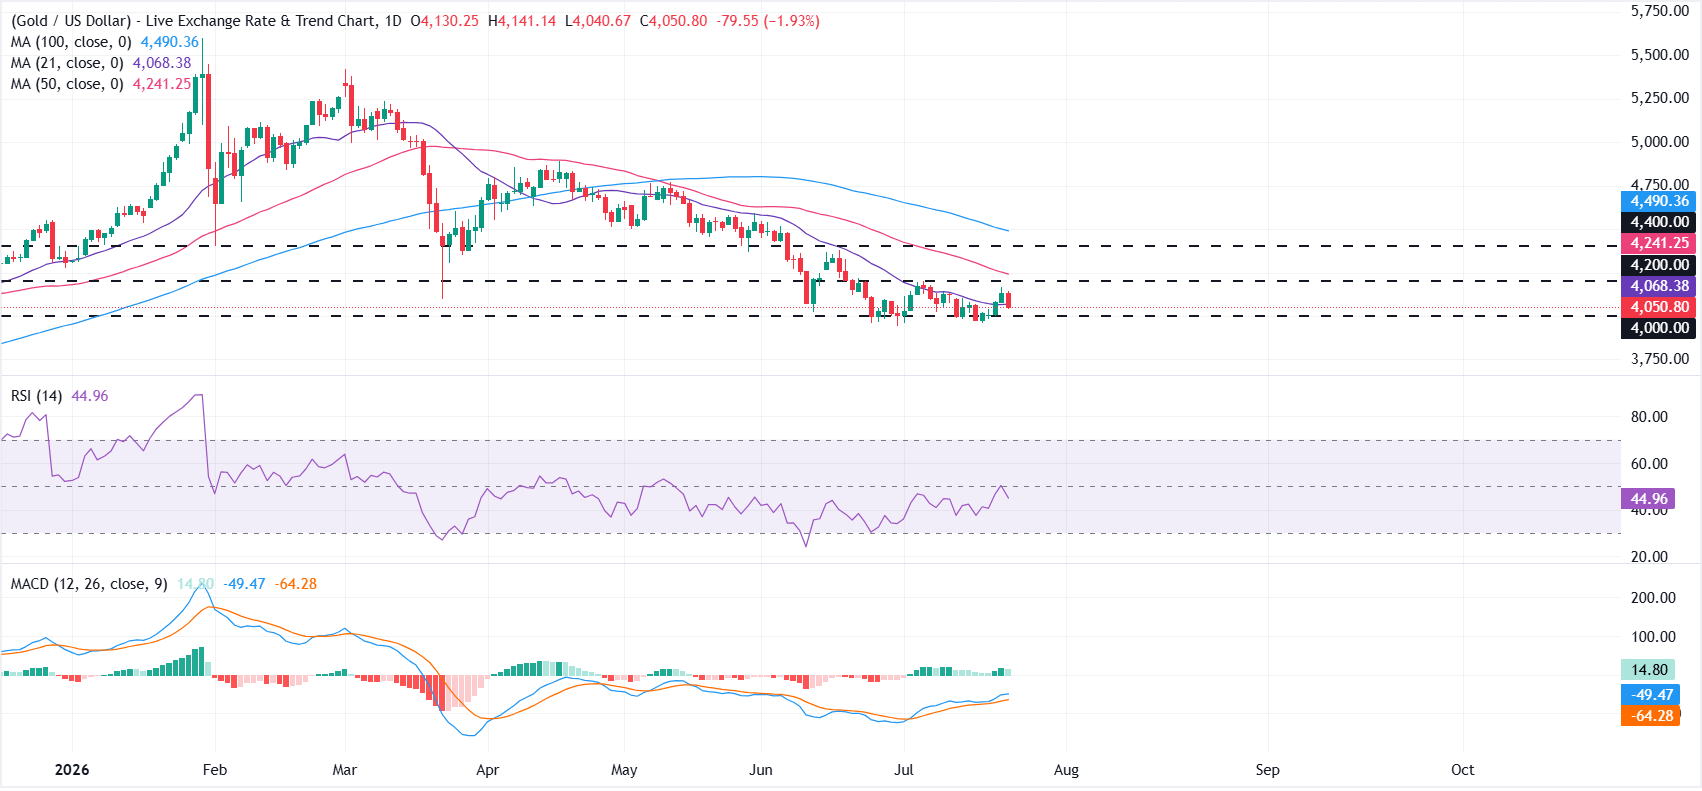
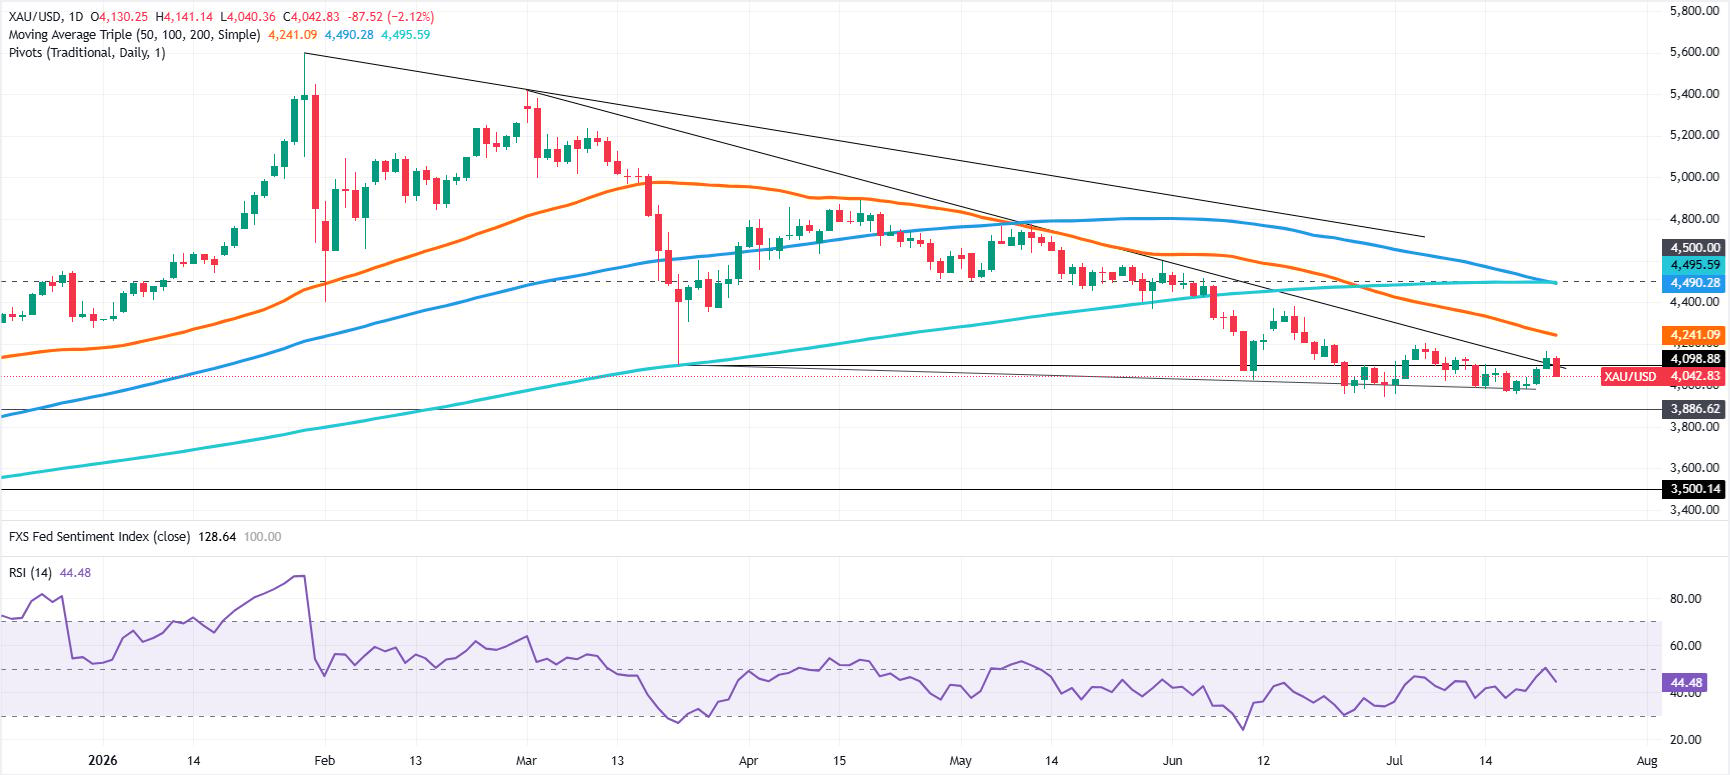
XAU/USD technical outlook: Gold tumbles back below $4,100, eyes on $4,000
Gold is retreating from weekly highs of $4,165, with the non-yielding metal extending its losses past $4,050. This suggests a possible trend change was short-lived, opening the door to further downside.
The downtrend market structure remains intact as long as Bullion prices remain below $4,200. Hence, the path of least resistance is tilted to the downside.
Gold’s first support should be $4,000. Below, the next support would be the year-to-date (YTD) low of $3,941, followed by the October 28, 2025, low of $3,886, ahead of the April 22, 2025, swing high-turned-support at $3,500.
On the other hand, if buyers hope to remain hopeful of higher prices, they must overcome the $4,100 mark. Above lies the weekly high of $4,165, ahead of $4,200.
Gold FAQs
Gold has played a key role in human’s history as it has been widely used as a store of value and medium of exchange. Currently, apart from its shine and usage for jewelry, the precious metal is widely seen as a safe-haven asset, meaning that it is considered a good investment during turbulent times. Gold is also widely seen as a hedge against inflation and against depreciating currencies as it doesn’t rely on any specific issuer or government.
Central banks are the biggest Gold holders. In their aim to support their currencies in turbulent times, central banks tend to diversify their reserves and buy Gold to improve the perceived strength of the economy and the currency. High Gold reserves can be a source of trust for a country’s solvency. Central banks added 1,136 tonnes of Gold worth around $70 billion to their reserves in 2022, according to data from the World Gold Council. This is the highest yearly purchase since records began. Central banks from emerging economies such as China, India and Turkey are quickly increasing their Gold reserves.
Gold has an inverse correlation with the US Dollar and US Treasuries, which are both major reserve and safe-haven assets. When the Dollar depreciates, Gold tends to rise, enabling investors and central banks to diversify their assets in turbulent times. Gold is also inversely correlated with risk assets. A rally in the stock market tends to weaken Gold price, while sell-offs in riskier markets tend to favor the precious metal.
The price can move due to a wide range of factors. Geopolitical instability or fears of a deep recession can quickly make Gold price escalate due to its safe-haven status. As a yield-less asset, Gold tends to rise with lower interest rates, while higher cost of money usually weighs down on the yellow metal. Still, most moves depend on how the US Dollar (USD) behaves as the asset is priced in dollars (XAU/USD). A strong Dollar tends to keep the price of Gold controlled, whereas a weaker Dollar is likely to push Gold prices up.