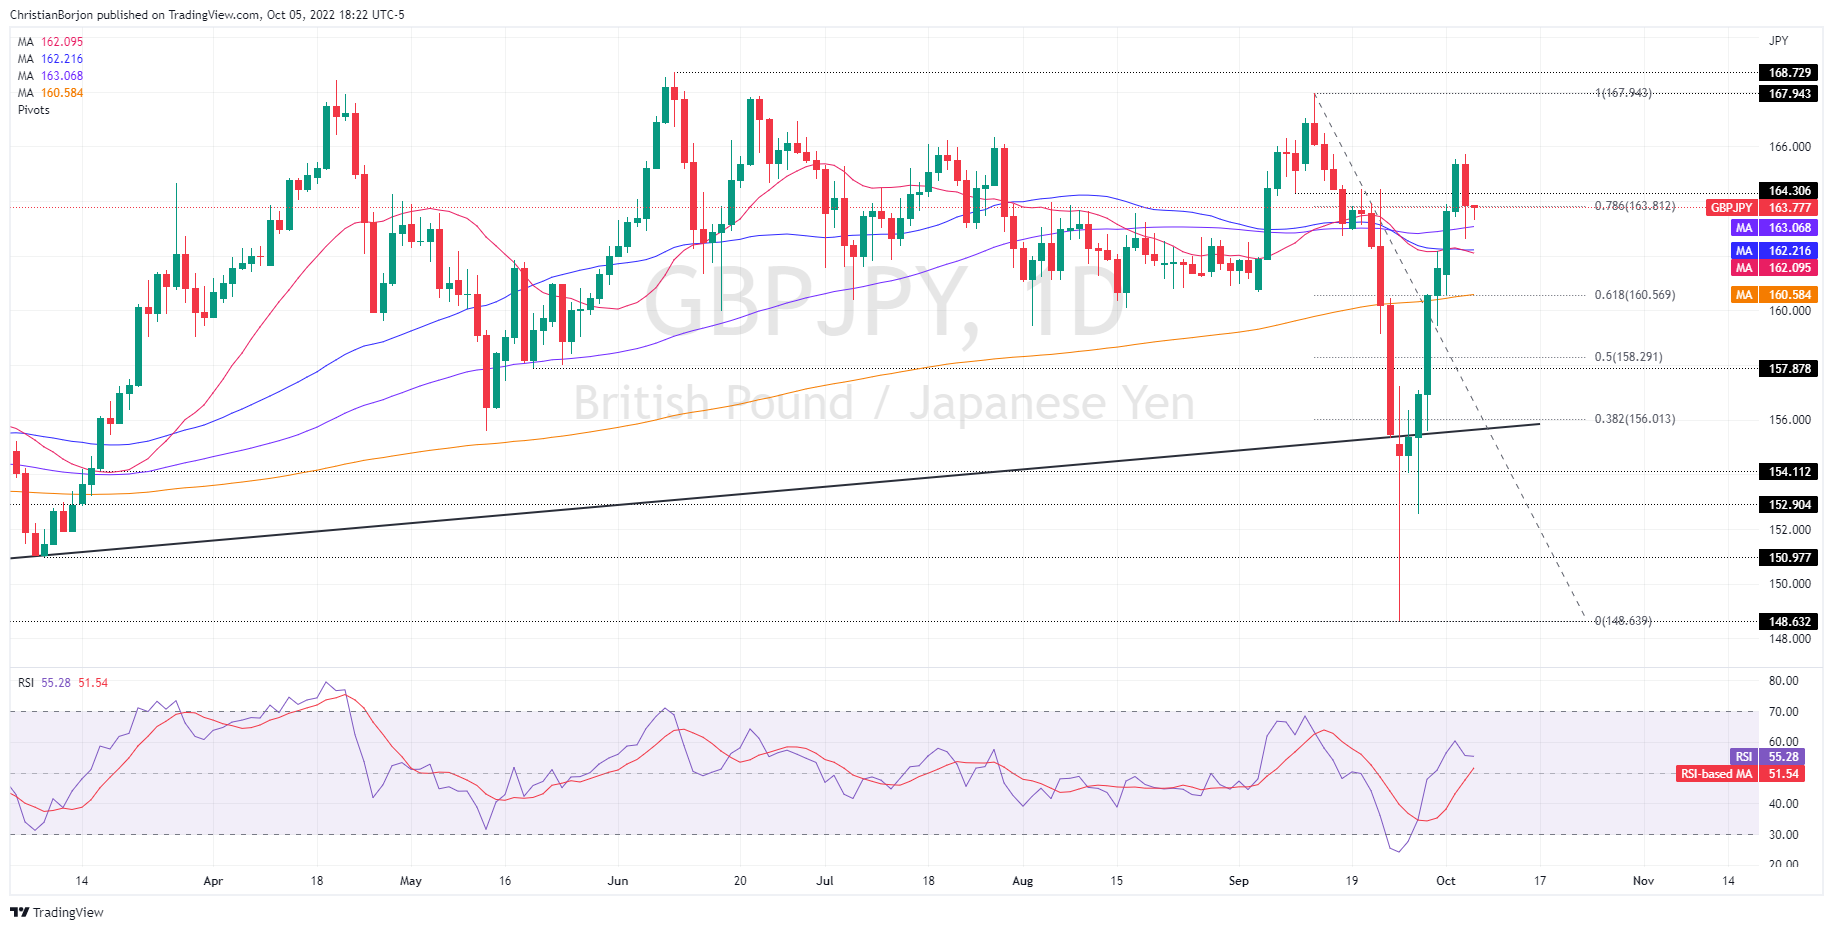
- The GBP/JPY daily chart delineates the pair as neutral-biased from a technical perspective.
- However, the pair meanders around the 78.6% Fibonacci retracement, which, once broken, will resume the GBP/JPY downtrend.
- Contrarily, a break above 164.00 could open the door for a re-test of the weekly high.
The GBP/JPY reached a fresh weekly high on Wednesday at 165.71 but plunged towards its daily low at 162.60 before retracing to current exchange rates for some reasons. Firstly, expectations of a possible Fed pivot extended the GBP/JPY uptrend since Monday. Nevertheless, Fed officials’ rhetoric emphasized the need for higher rates for longer, spurring a risk-off impulse. Therefore, as the Asian session begins, the GBP/JPY is trading at 163.77, below its opening price.
The GBP/JPY is neutral-biased from a daily chart perspective, even though the pair managed to stay above the 100, 50, and 20-day EMAs. Nevertheless, it’s meandering around the 78.6% Fibonacci level, drawn from the September 13-26 high at 167.94/low at 148.63, which, if broken to the downside, might pave the way for further losses.
If that scenario plays out, the GBP/JPY first support would be the 100-day EMA at 163.07, which, once cleared, will expose the confluence of the 50 and 20-day EMAs, around 162.10/20. A decisive break might send the pair plummeting to the junction of the 200-day EMA and the 61.8% Fibonacci retracement at 160.57.
On the other hand, if GBP/JPY buyers hold the price above 163.81, it could open the door for further gains. The GBP/JPY’s first resistance would be the 164.00 figure, followed by 165, and then the October 5 daily high at 165.71.
GBP/JPY Daily Chart