- Bitcoin price may be setting up for a sweep of the yearly low.
- BTC broke through the trend channel that supported the previous rally.
- Invalidation of the bearish thesis is a breach above $17,250.
Bitcoin price points south but sidelined bears should wait for confirmation to avoid a countertrend liquidity hunt. Key levels have been defined to determine BTC’s next potential move.
Bitcoin price will soon make a move
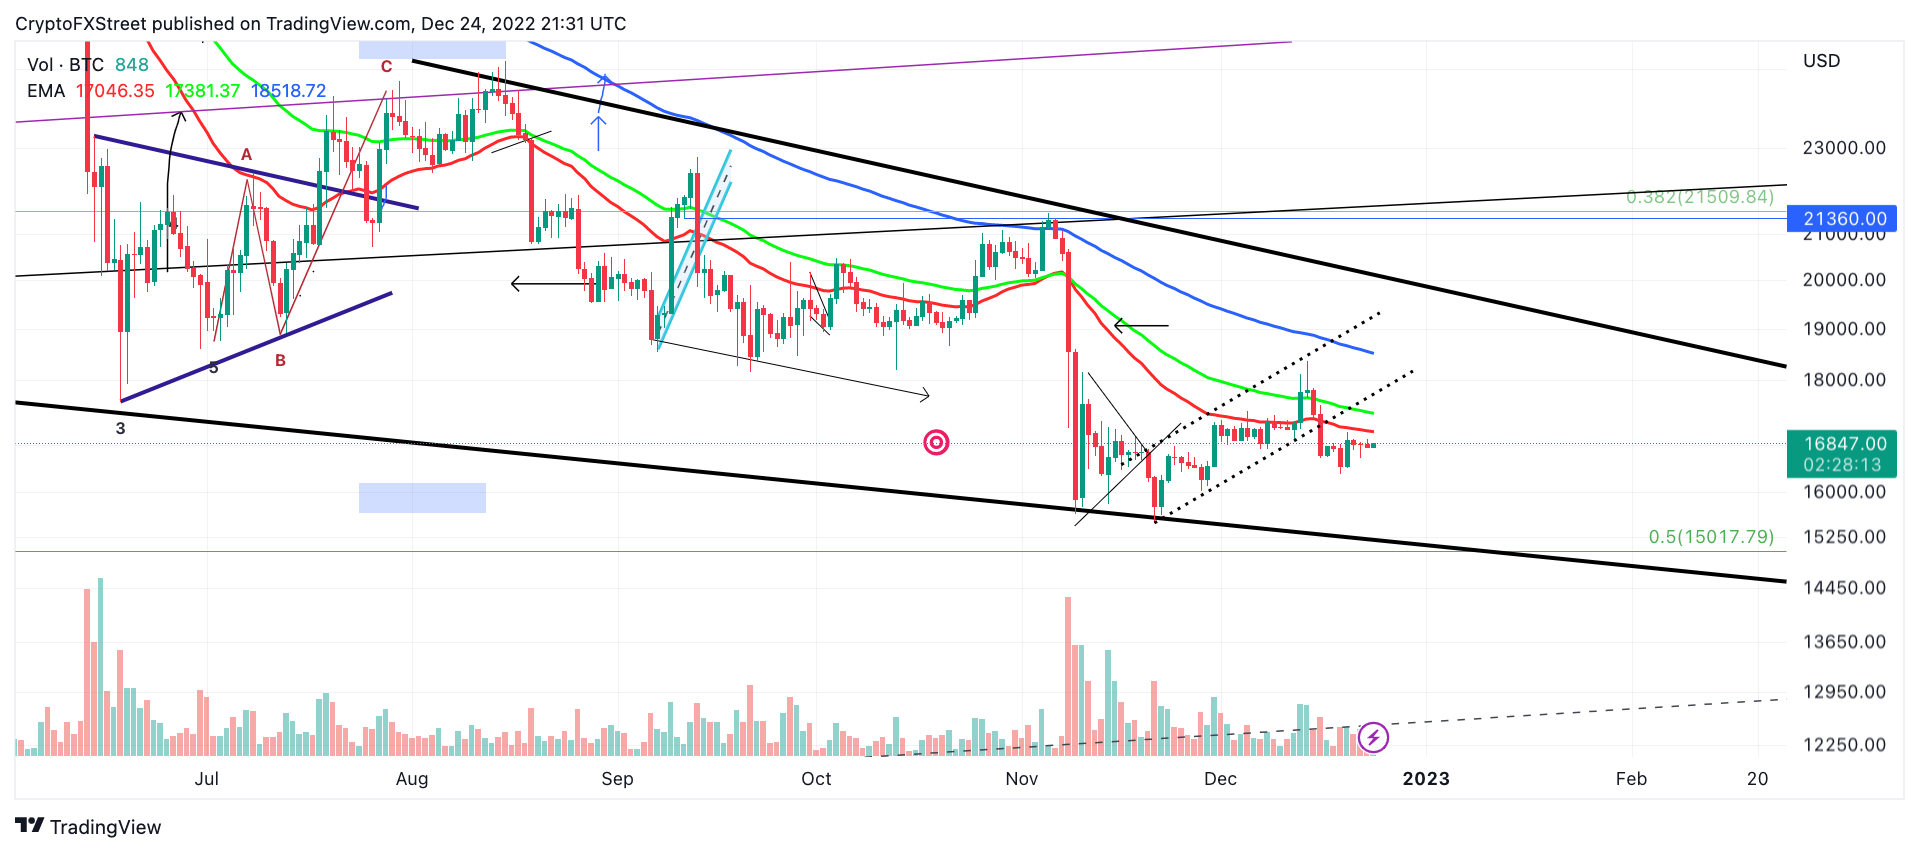
BTC price shows early evidence of a liquidation event underway. On December 16, The bulls breached through an ascending channel that aided BTC’s 17% rally since falling into the mid-$15,000 zone. A week later, the peer-to-peer digital currency still hovers below the breached barrier showing no signs of a bullish retaliation in sight.
Bitcoin price currently auctions at $16,842. On December 24, the original cryptocurrency is submerged below the 50-day, 100-day and 200-day simple moving averages (SMA), which suggests that Bitcoin is in a very strong downtrend. At the time of writing, the bulls have not yet had a re-encounter with the closest moving average (the 50-day SMA) amongst the three or the recently breached trend channel.
A test of the aforementioned levels could be the signal sidelined bears are looking for to enter the market. Ultimately the safest confirmation that the downtrend’s move is continuing south will be a breach of the previous week’s low at $16,293. If the breach occurs, the yearly low at $15,479 will be in jeopardy. The bears trigger a sell-off targeting 2020 liquidity zones near $14,000, resulting in a 16% decline from the current BTC price.
BTC/USDT 1-Day Chart
On the contrary, traders should pay close attention to BTC if the breach of the 50-day SMA at $17,200 occurs. If the bulls can consolidate above the indicator, an additional rise toward the 200-day SMA at $18,600 would stand a fair chance of occurring. The Bitcoin price would rise by 12% as a result of the bullish scenario.
