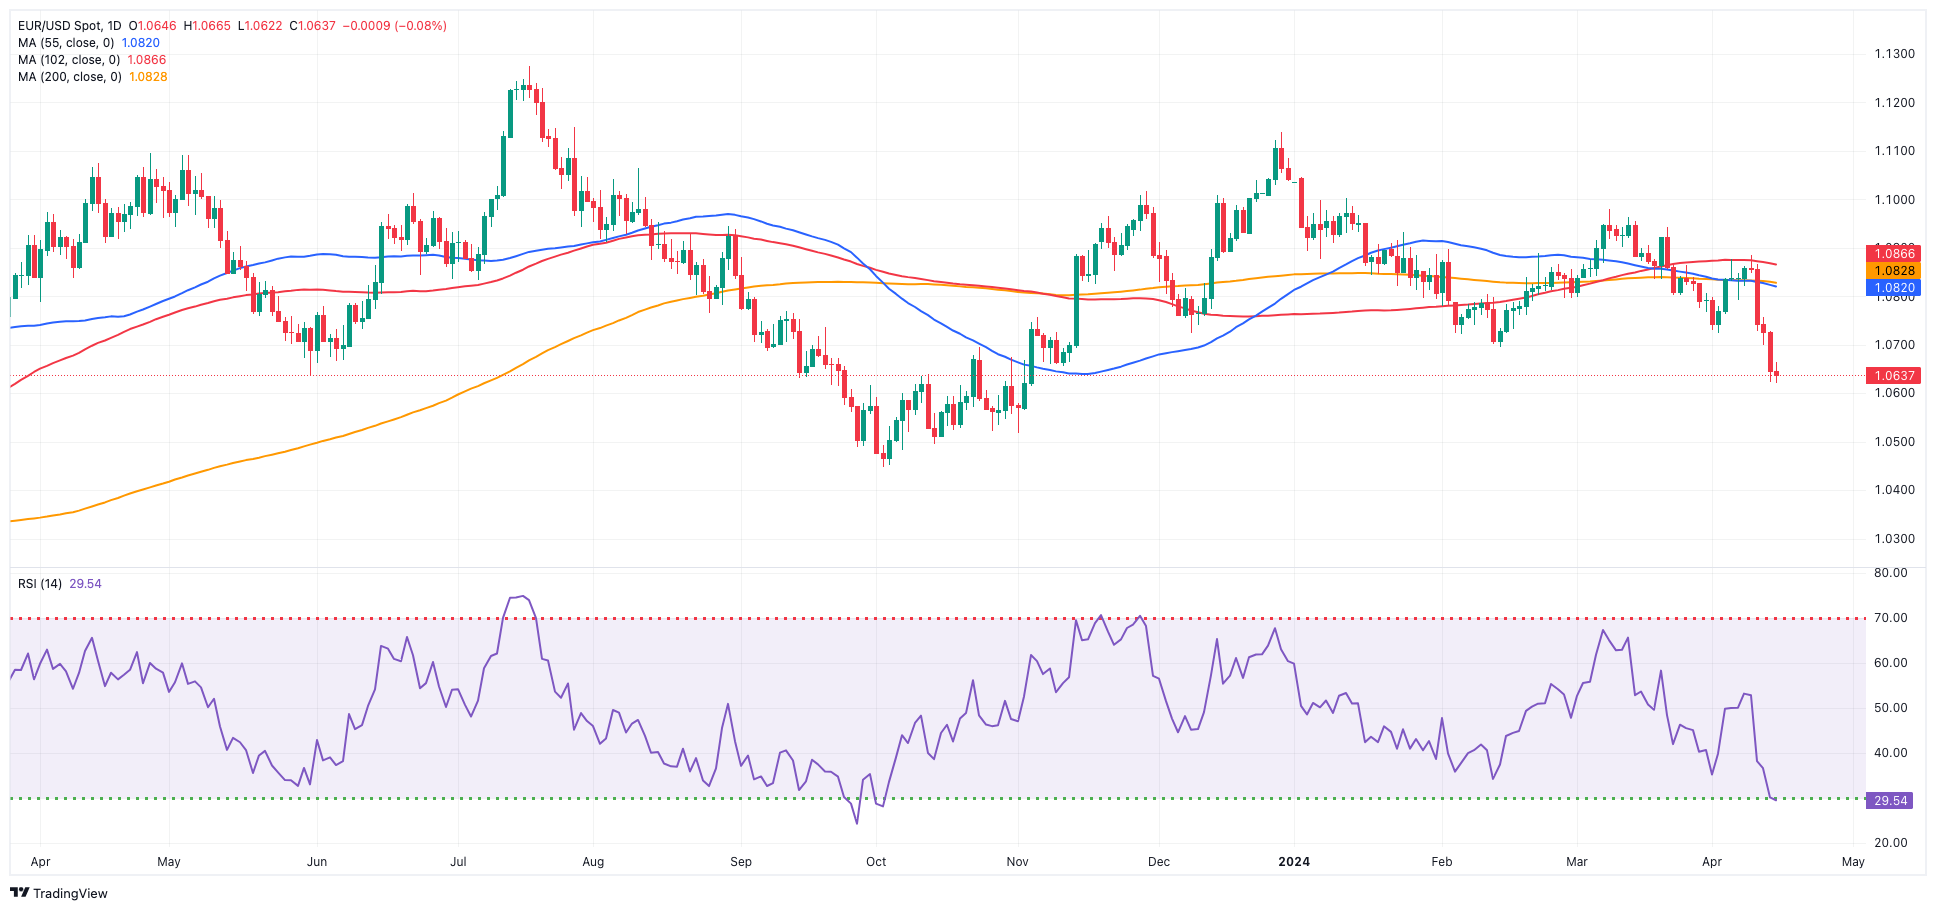
- EUR/USD dropped to fresh YTD lows near 1.0620.
- The US Dollar accelerated its gains amidst higher yields.
- The ECB’s Simkus favoured 50 bps of rate cuts in the summer.
For the fifth consecutive session, EUR/USD remained under pressure, sliding to levels around the 1.0620 zone and reaching new 2024 lows amidst continued strength in the US Dollar (USD).
This upward momentum in the Dollar coincided with investors re-evaluating the timing of a potential rate cut, likely to occur later than previously expected, possibly in December. This reassessment occurred alongside another increase in US yields across the curve and a firmer narrative regarding the divergence of monetary policy between the Federal Reserve (Fed) and the rest of its G10 peers, especially the European Central Bank (ECB).
Once again, another surge in the Greenback led the USD Index (DXY) to achieve fresh year-to-date highs past the 106.00 barrier, underpinned by recent higher-than-expected US inflation figures as measured by the CPI in March.
Meanwhile, the ECB meeting brought no surprises last week, with the central bank leaving its rates unchanged as widely anticipated. However, there were clearer indications that the ECB might be considering a rate cut, especially given the ongoing decline in eurozone inflation.
Still around the ECB, Board member Simkus suggested earlier in the session a potential extra rate cut in July, leaving 50 bps of rate reductions in place over the summer.
Looking ahead, the relatively subdued economic fundamentals in the eurozone, coupled with the resilience of the US economy, reinforce the expectation of a stronger Dollar in the medium term, particularly considering the possibility of the ECB lowering rates before the Fed. In such a scenario, EUR/USD is anticipated to experience a more pronounced decline from a short-term perspective.
EUR/USD daily chart
EUR/USD short-term technical outlook
The breakdown of the 2024 low of 1.0621 (April 15) could put a probable visit to the November 2023 low of 1.0516 (November 1) back on the radar prior to the weekly low of 1.0495 (October 13, 2023), the 2023 bottom of 1.0448 (October 3), and the round milestone of 1.0400.
On the upside, EUR/USD is projected to find early resistance at the key 200-day SMA of 1.0827, ahead of the April top of 1.0885 (April 9), followed by the March peak of 1.0981 (March 8) and the weekly high of 1.0998 (January 11), all preceding the psychological barrier of 1.1000. Further advances from here could challenge the December 2023 top of 1.1139 (December 28).
The 4-hour chart shows that the bearish trend appears intact for the time being. Against that, the initial support arrives at 1.0621 seconded by 1.0516. In the other direction, there is initial up-barrier at 1.0716, ahead of the 55-SMA at 1.0780 and the 100-SMA at 1.0790. The Moving Average Convergence Divergence (MACD) fell further into the negative zone, while the Relative Strength Index (RSI) slid to around 23.
