- GBP/USD has been fluctuating in a tight range above 1.2100.
- Pound Sterling could attract buyers if it manages to clear 1.2200.
- US Dollar stays under bearish pressure following BOJ event.
GBP/USD has extended its sideways grind above 1.2100 into the second straight day on Tuesday. The broad-based selling pressure surrounding the US Dollar helps the pair limit its losses but the risk-averse market environment doesn’t allow it to gather bullish momentum.
In the absence of high-impact macroeconomic data releases, the Bank of Japan’s (BOJ) policy decisions triggered a significant market reaction early Tuesday.
Although the BOJ left its policy rate and the target for 10-year Japanese government bond (JGB) yield unchanged at -0.1% and 0%, respectively, it announced that it will allow the 10-year JGB yield to fluctuate between 0.5% and -0.5%. This policy tweak in yield curve control caused the Japanese Yen to capture capital outflows out of the US Dollar and USD/JPY was last seen losing nearly 500 pips on the day.
In the meantime, the BOJ’s unexpected action seems to be weighing on market sentiment and making it difficult for the Pound Sterling to gather strength. Hence, GBP/USD struggles to make a decisive move in either direction. Reflecting the souring market mood, US stock index futures are down between 0.65% and 1.05%.
In the second half of the day, November Housing Starts and Building Permits data from the US will be looked upon for fresh impetus. Conditions in the US housing market have been worsening with the Federal Reserve rate hikes hurting the mortgage demand. A significant decline in these data could force the US Dollar to stay on the back foot and vice versa.
Unless the market mood improves with Wall Street’s main indexes turning positive on the day, however, the US Dollar could show some resilience against its rivals.
GBP/USD Technical Analysis
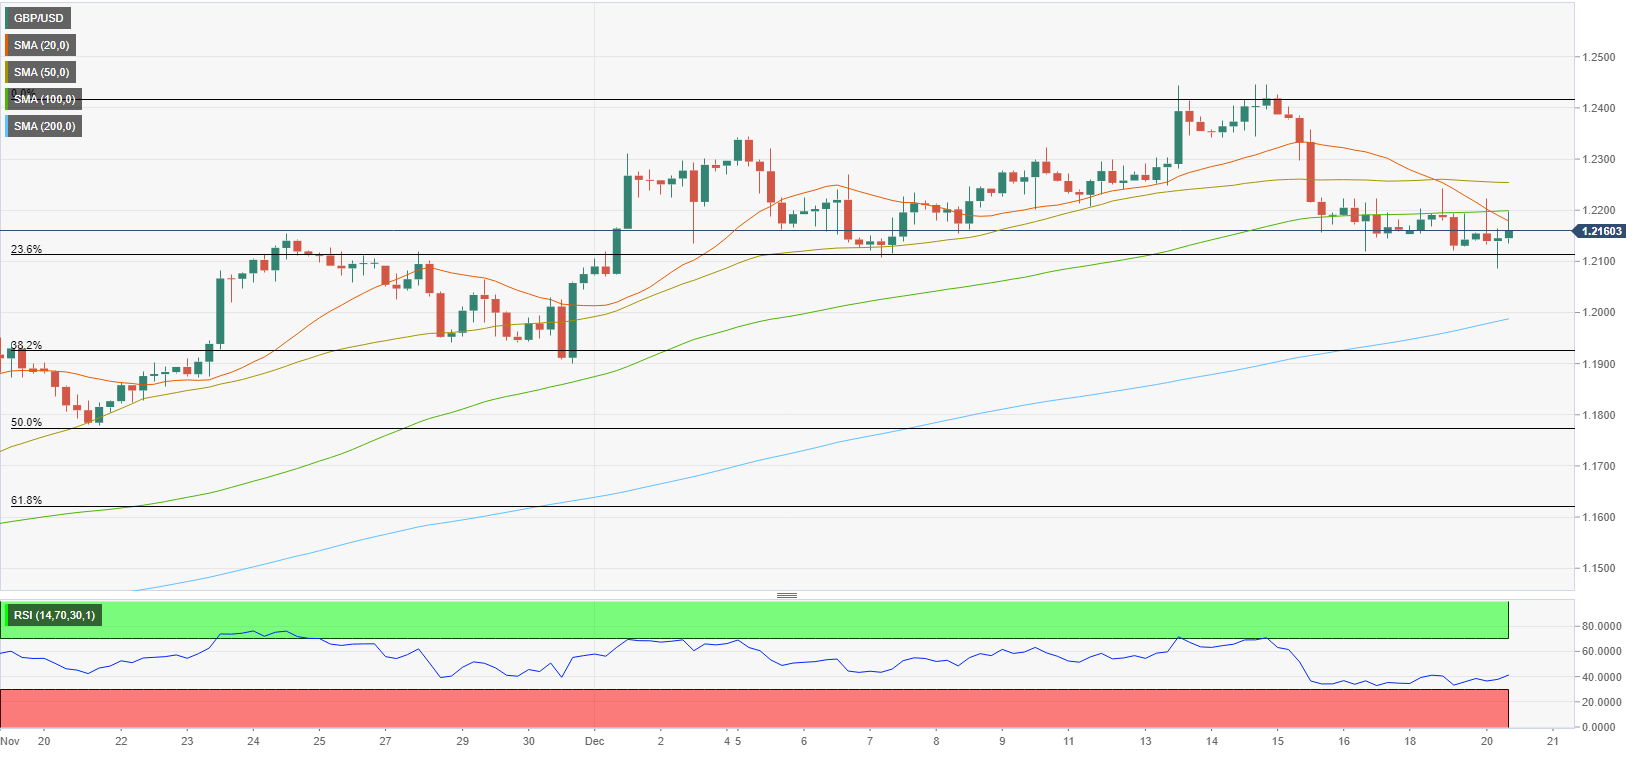
The Relative Strength Index (RSI) indicator on the four-hour chart stays near 40 early Tuesday, suggesting that buyers remain on the sidelines. On the upside, 1.2200 (100-period Simple Moving Average (SMA) on the four-hour chart) aligns as key resistance. In case GBP/USD rises above that level and stabilizes there, it could target 1.2255 (50-period SMA) and 1.2300 (psychological level).
1.2100 (Fibonacci 23.6% retracement of the latest uptrend) forms strong support. A four-hour close below that level could open the door for an extended slide toward 1.2000, where the 200-period SMA is located.
