- Gold price attracts sellers for the third straight day amid some follow-through USD strength.
- Trade optimism remains supportive of the upbeat mood and undermines the precious metal.
- The Fed uncertainty could cap the USD and help limit losses for the non-yielding commodity.
Gold price (XAU/USD) extends its steady intraday descent through the first half of the European session and drops to a fresh daily low, back closer to the $3,350 level in the last hour. Thursday’s US macro data reaffirmed bets that the Federal Reserve (Fed) will keep rates steady next week. This, in turn, assists the US Dollar (USD) in attracting some follow-through buyers for the second straight day and driving flows away from the non-yielding yellow metal.
Apart from this, the trade optimism turns out to be another factor undermining the Gold price. However, a slight deterioration in the risk sentiment, as depicted by a generally weaker tone around the equity markets, could offer some support to the safe-haven precious metal. Furthermore, concerns about the Fed’s independence could act as a headwind for the USD and also limit losses for the commodity ahead of the crucial FOMC policy meeting next week.
Daily Digest Market Movers: Gold price continues to lose ground as modest USD strength offsets softer risk tone
- Data released on Thursday pointed to a still resilient US labor market and reinforced the view that the Federal Reserve will hold interest rates at the upcoming monetary policy meeting next week. The US Department of Labour reported that the number of US citizens submitting new applications for unemployment insurance fell for the sixth straight week, to 217K during the week ended July 19. This marked the lowest reading since mid-April.
- Furthermore, the S&P Global’s US Composite PMI climbed to 54.6 in July from 52.9 in the previous month, marking the 30th straight month of expansion. The growth was concentrated in the services sector, which offsets weakness in the manufacturing sector. The Services PMI rose from 52.9 to 55.2, marking the strongest expansion since the start of the year, while the gauge for the manufacturing sector contracted for the first time since December 24.
- Further details of the report revealed that employment strength across both the manufacturing and services sectors continues to support near-term stability. Adding to this, intensifying price pressures suggest that inflation could accelerate in the second half of the year, mainly because of tariffs on imports. This might further force the Fed to maintain the status quo on rates despite US President Donald Trump’s repeated calls to lower borrowing costs.
- Trump dialed up the pressure on Fed Chair Jerome Powell during a rare presidential visit to the central bank’s headquarters. Moreover, Fed Governor Chris Waller and Trump appointee Vice Chair for Supervision Michelle Bowman have advocated a rate reduction as soon as the next policy decision on July 30. This could act as a headwind for the USD and offer support to the non-yielding Gold price amid the rising Thailand-Cambodia border dispute.
Gold price bears might await break below 100-SMA on H4 and channel support before placing fresh bets
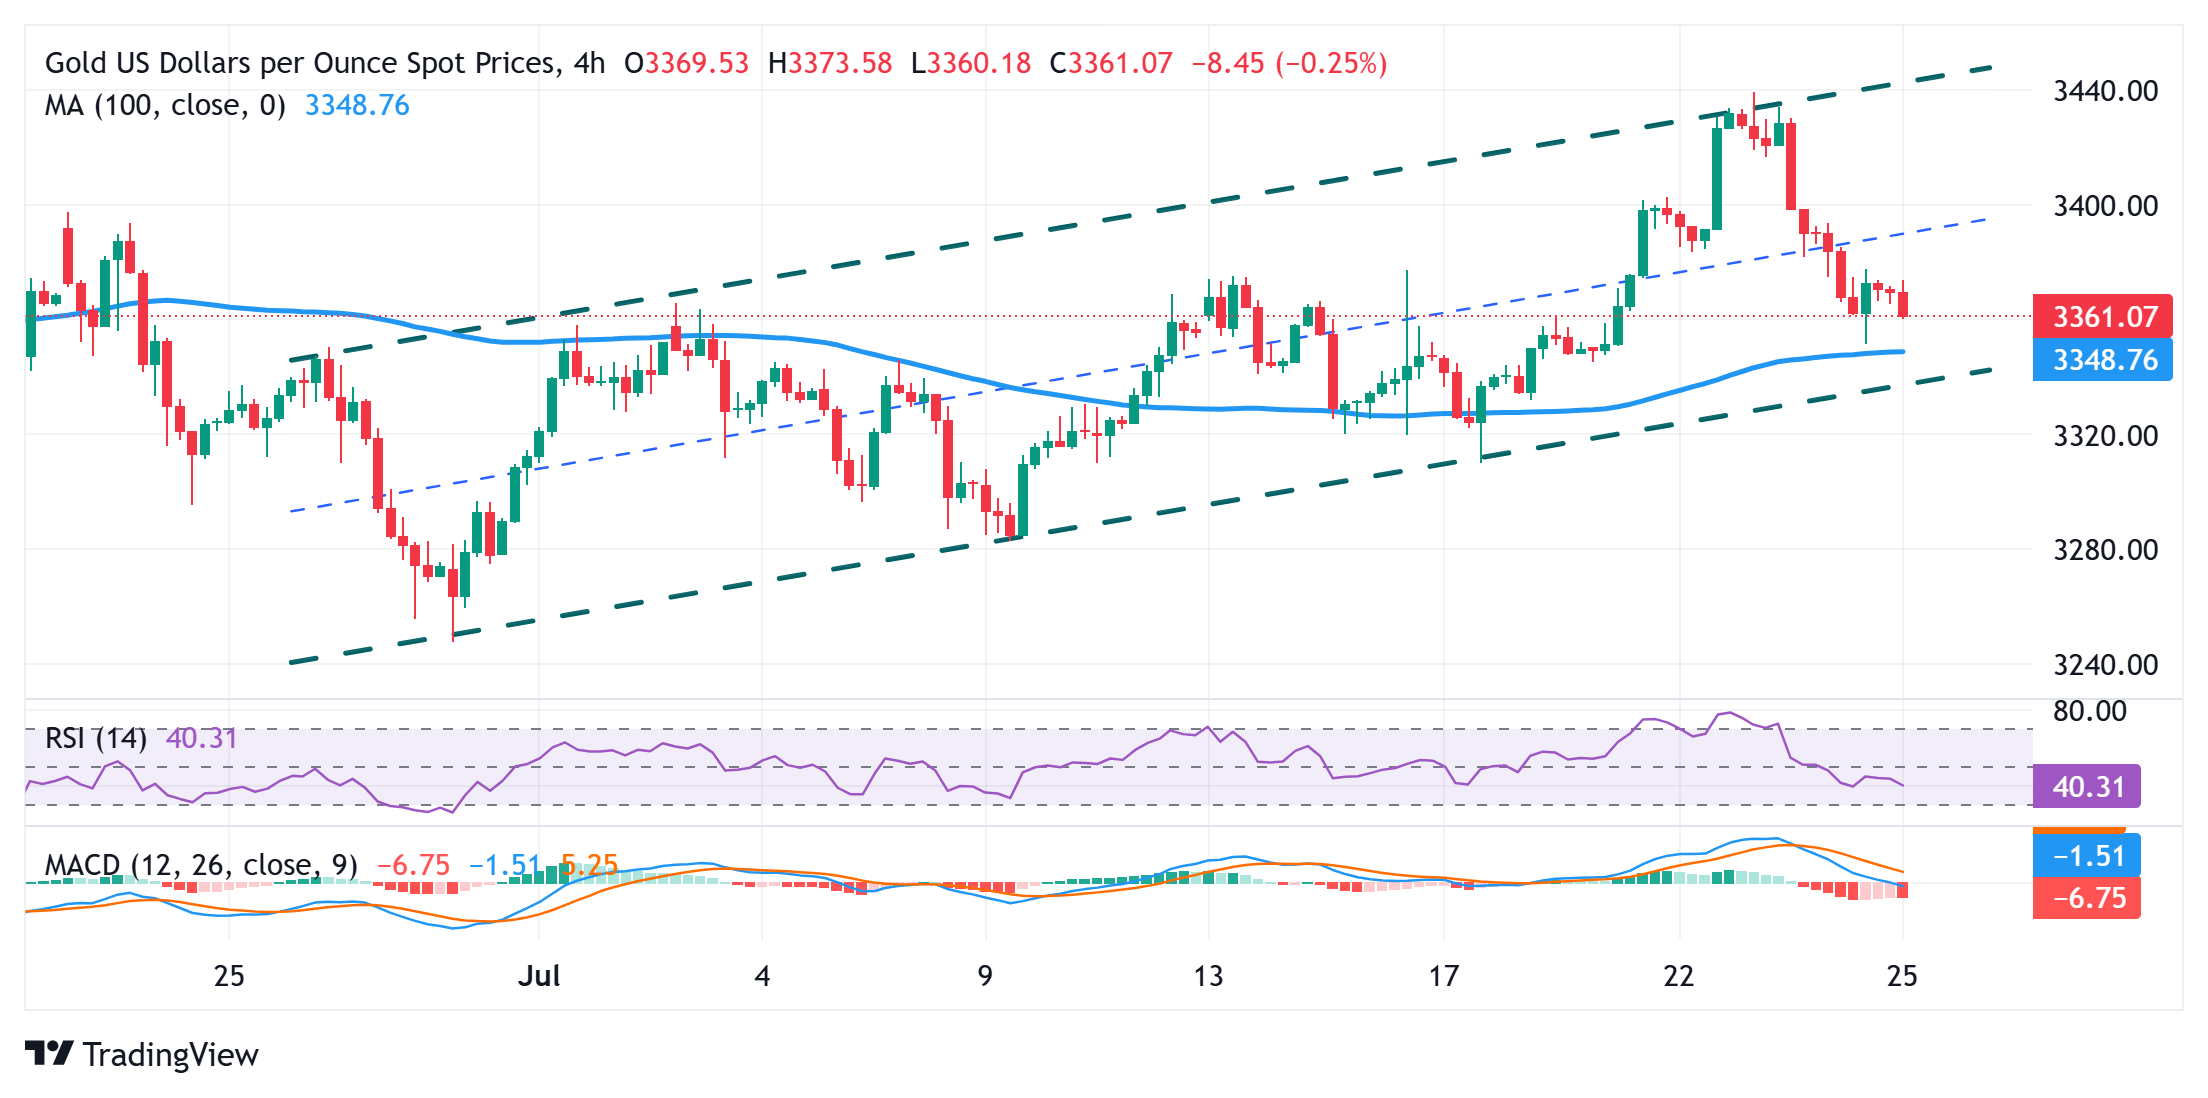
The overnight bounce from the vicinity of the 100-period Simple Moving Average (SMA) on the 4-hour chart runs out of steam near the $3,377 region. The said area should now act as an immediate strong barrier, above which a bout of short-covering could allow the Gold price to reclaim the $3,400 mark. Some follow-through buying should pave the way for a move towards the $3,438-3,440 static barrier, which coincides with the top boundary of an ascending channel held since the beginning of this month.
On the flip side, Thursday’s swing low, around the $3,351 area, which nears the 100-period SMA on the 4-hour chart, might continue to protect the immediate downside for the Gold price. This is followed by the trend-channel support around the $3,335 region. A convincing break below the latter might shift the near-term bias in favor of the XAU/USD bears and expose last week’s swing low, around the $3,309 area. The commodity could weaken further below the $3,300 mark and retest the monthly trough, around the $3,283-3,282 zone.
Economic Indicator
Durable Goods Orders
The Durable Goods Orders, released by the US Census Bureau, measures the cost of orders received by manufacturers for durable goods, which means goods planned to last for three years or more, such as motor vehicles and appliances. As those durable products often involve large investments they are sensitive to the US economic situation. The final figure shows the state of US production activity. Generally speaking, a high reading is bullish for the USD.
Next release: Fri Jul 25, 2025 12:30
Frequency: Monthly
Consensus: -10.8%
Previous: 16.4%
Source: US Census Bureau