Ripple (XRP) falters, trading near $1.40 at the time of writing on Monday. Since the August rally to $1.70, the remittance token has seen capped upside, prompting profit-taking. If the token’s technical structure continues to weaken, recovery could be an uphill battle, while raising the odds of an extended sell-off.
XRP wobbles amid muted ETF demand
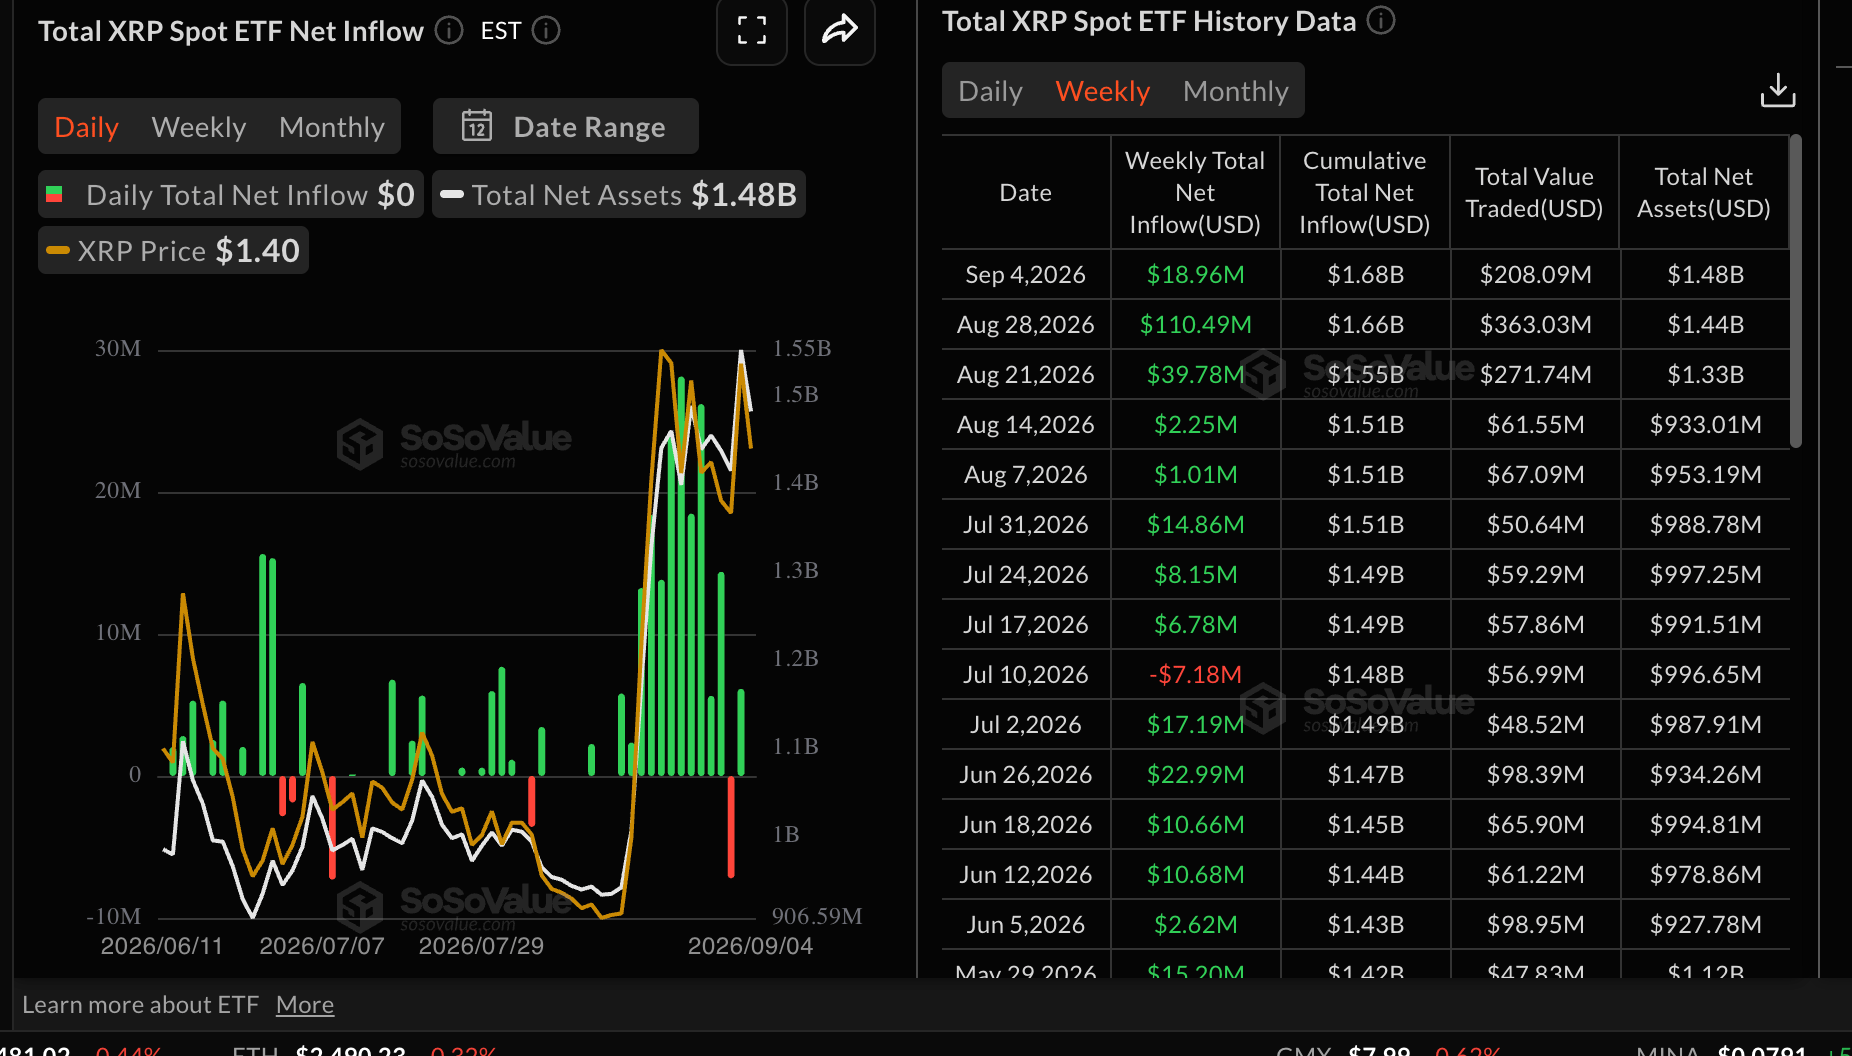
US-listed XRP spot Exchange-Traded Funds (ETFs) remained muted on Friday, without any flows, according to SoSoValue. This suggests institutional investors may be adopting a cautious stance ahead of the Federal Reserve (Fed) decision on interest rates and the ongoing conflict between the United States (US) and Iran.
Despite weak demand, inflows totaled $19 million through Friday, marking an eight-week bullish streak. Meanwhile, cumulative inflows remain steady at $1.68 billion, undermining institutional investors’ long-term positive outlook on XRP. Assets under management hold at $1.48 billion.
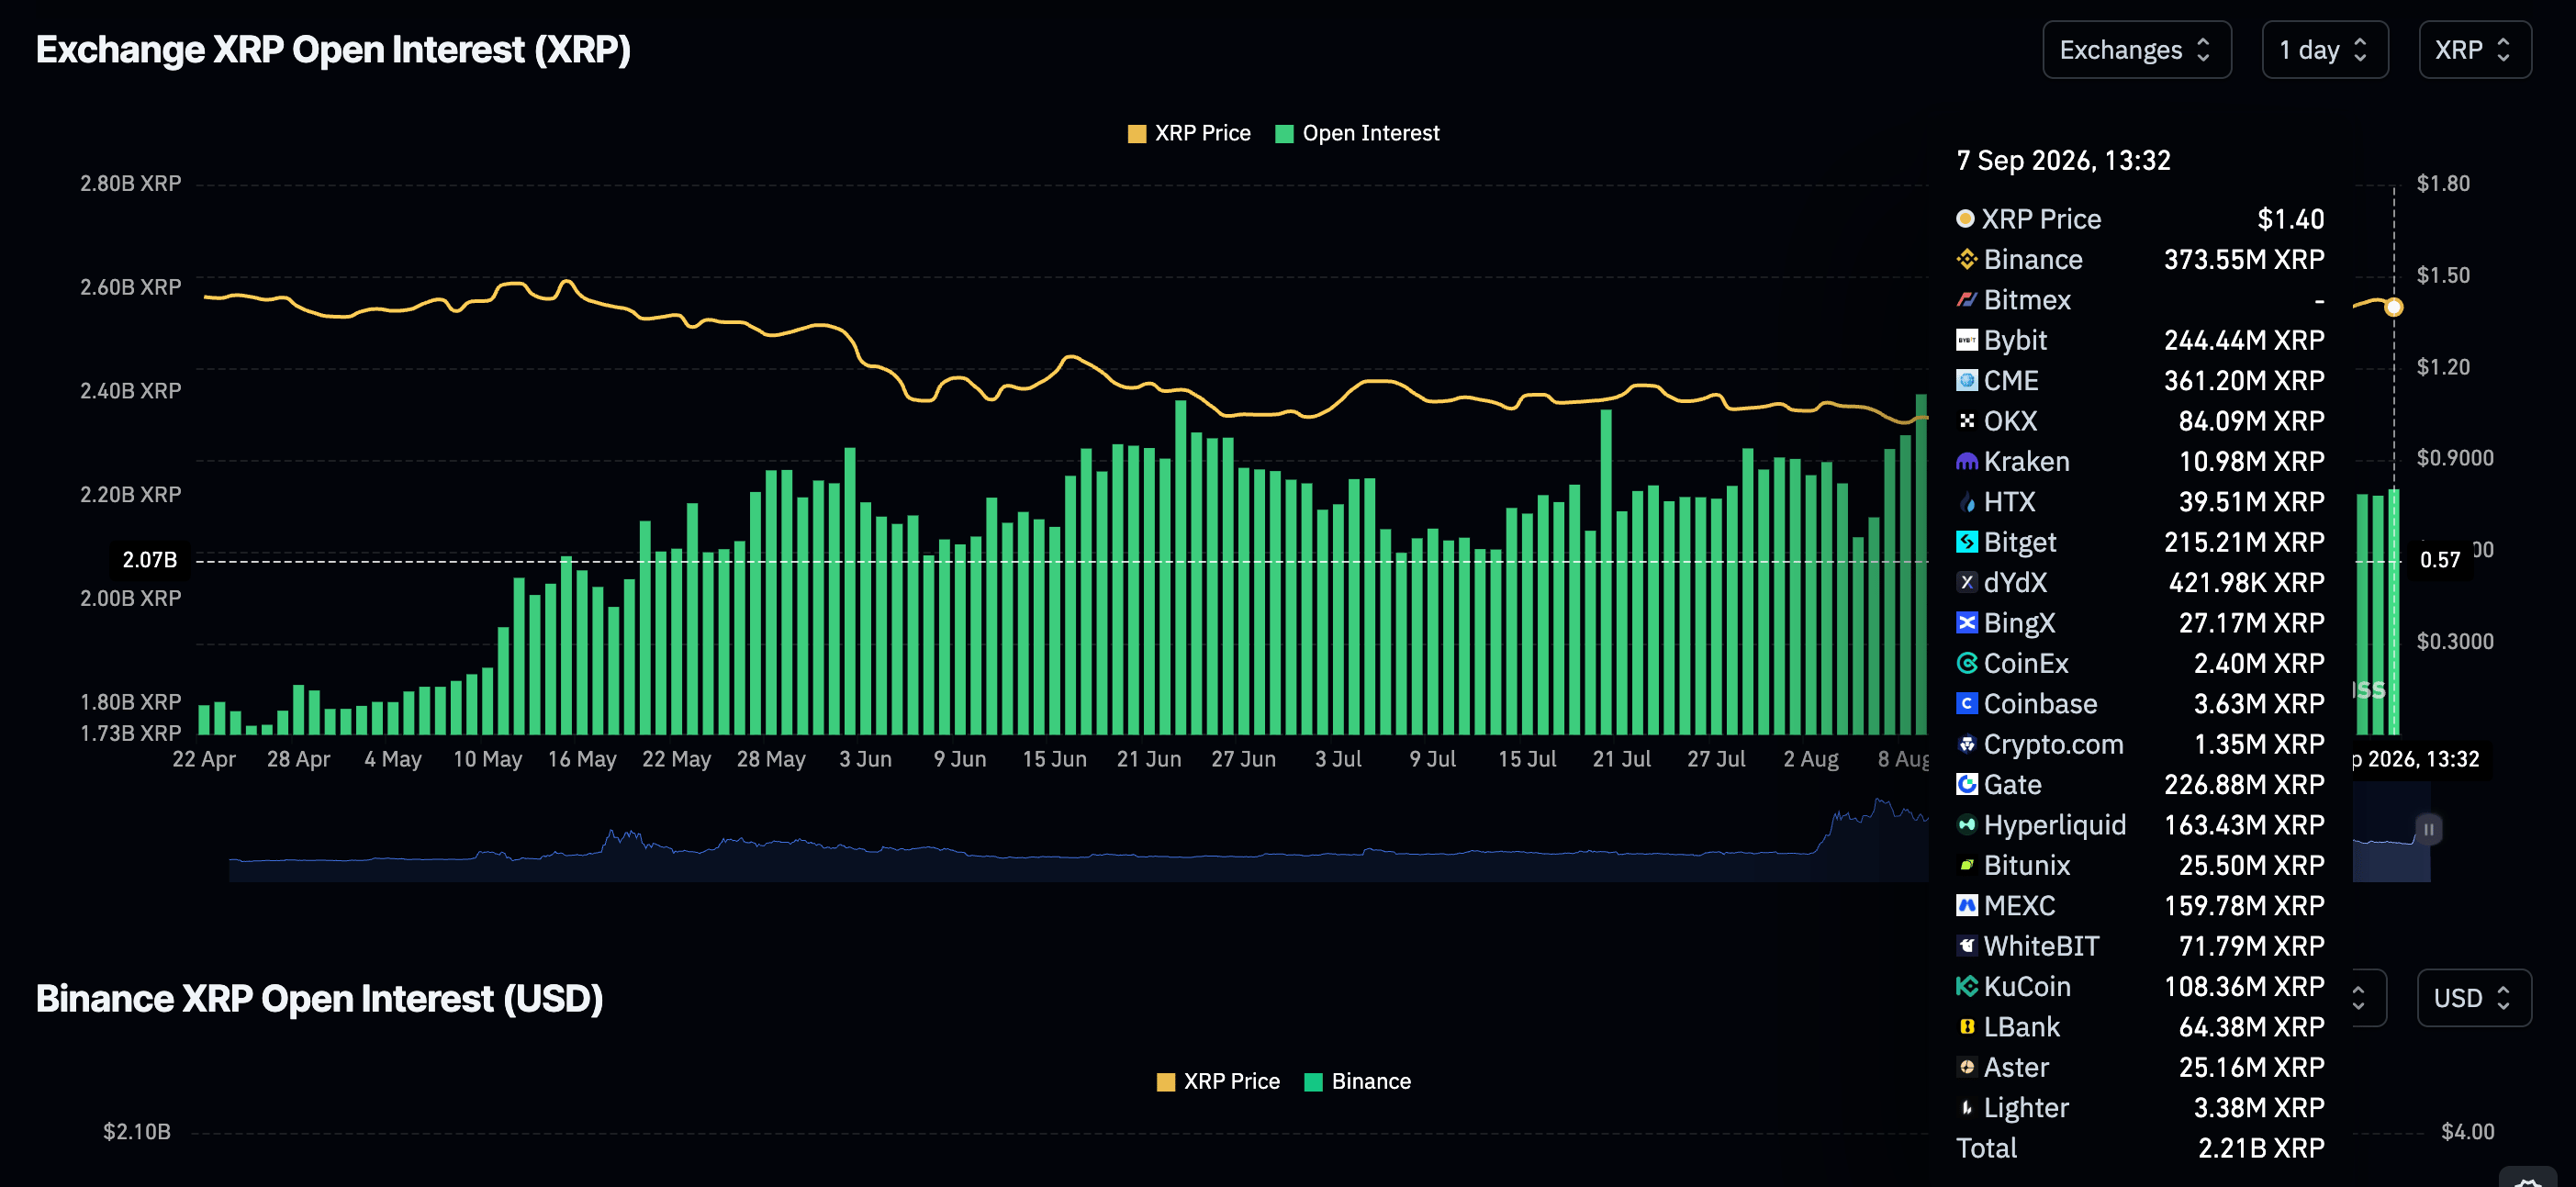
The derivatives market has stabilized, with perpetual futures Open Interest (OI) rising only marginally to 2.21 billion XRP on Monday, from 2.2 billion XRP the previous day. While the minor increase is commendable, it falls short compared to the broader correction from 2.78 on August 15. Rising OI is needed to reinforce the bullish outlook and increase the odds of a steady recovery.
Technical analysis: XRP tests key support
XRP trades at $1.40, holding a modest bullish bias as price remains above the main Exponential Moving Averages (EMAs). The 50-day, 100-day and 200-day EMAs at roughly $1.25, $1.24 and $1.36 sit below spot and suggest underlying trend support, even as the recent advance has stalled.
The Parabolic SAR at $1.61 remains well above the market, while the Relative Strength Index (RSI) has eased to about 59, pointing to cooling but still positive momentum after an overbought phase.
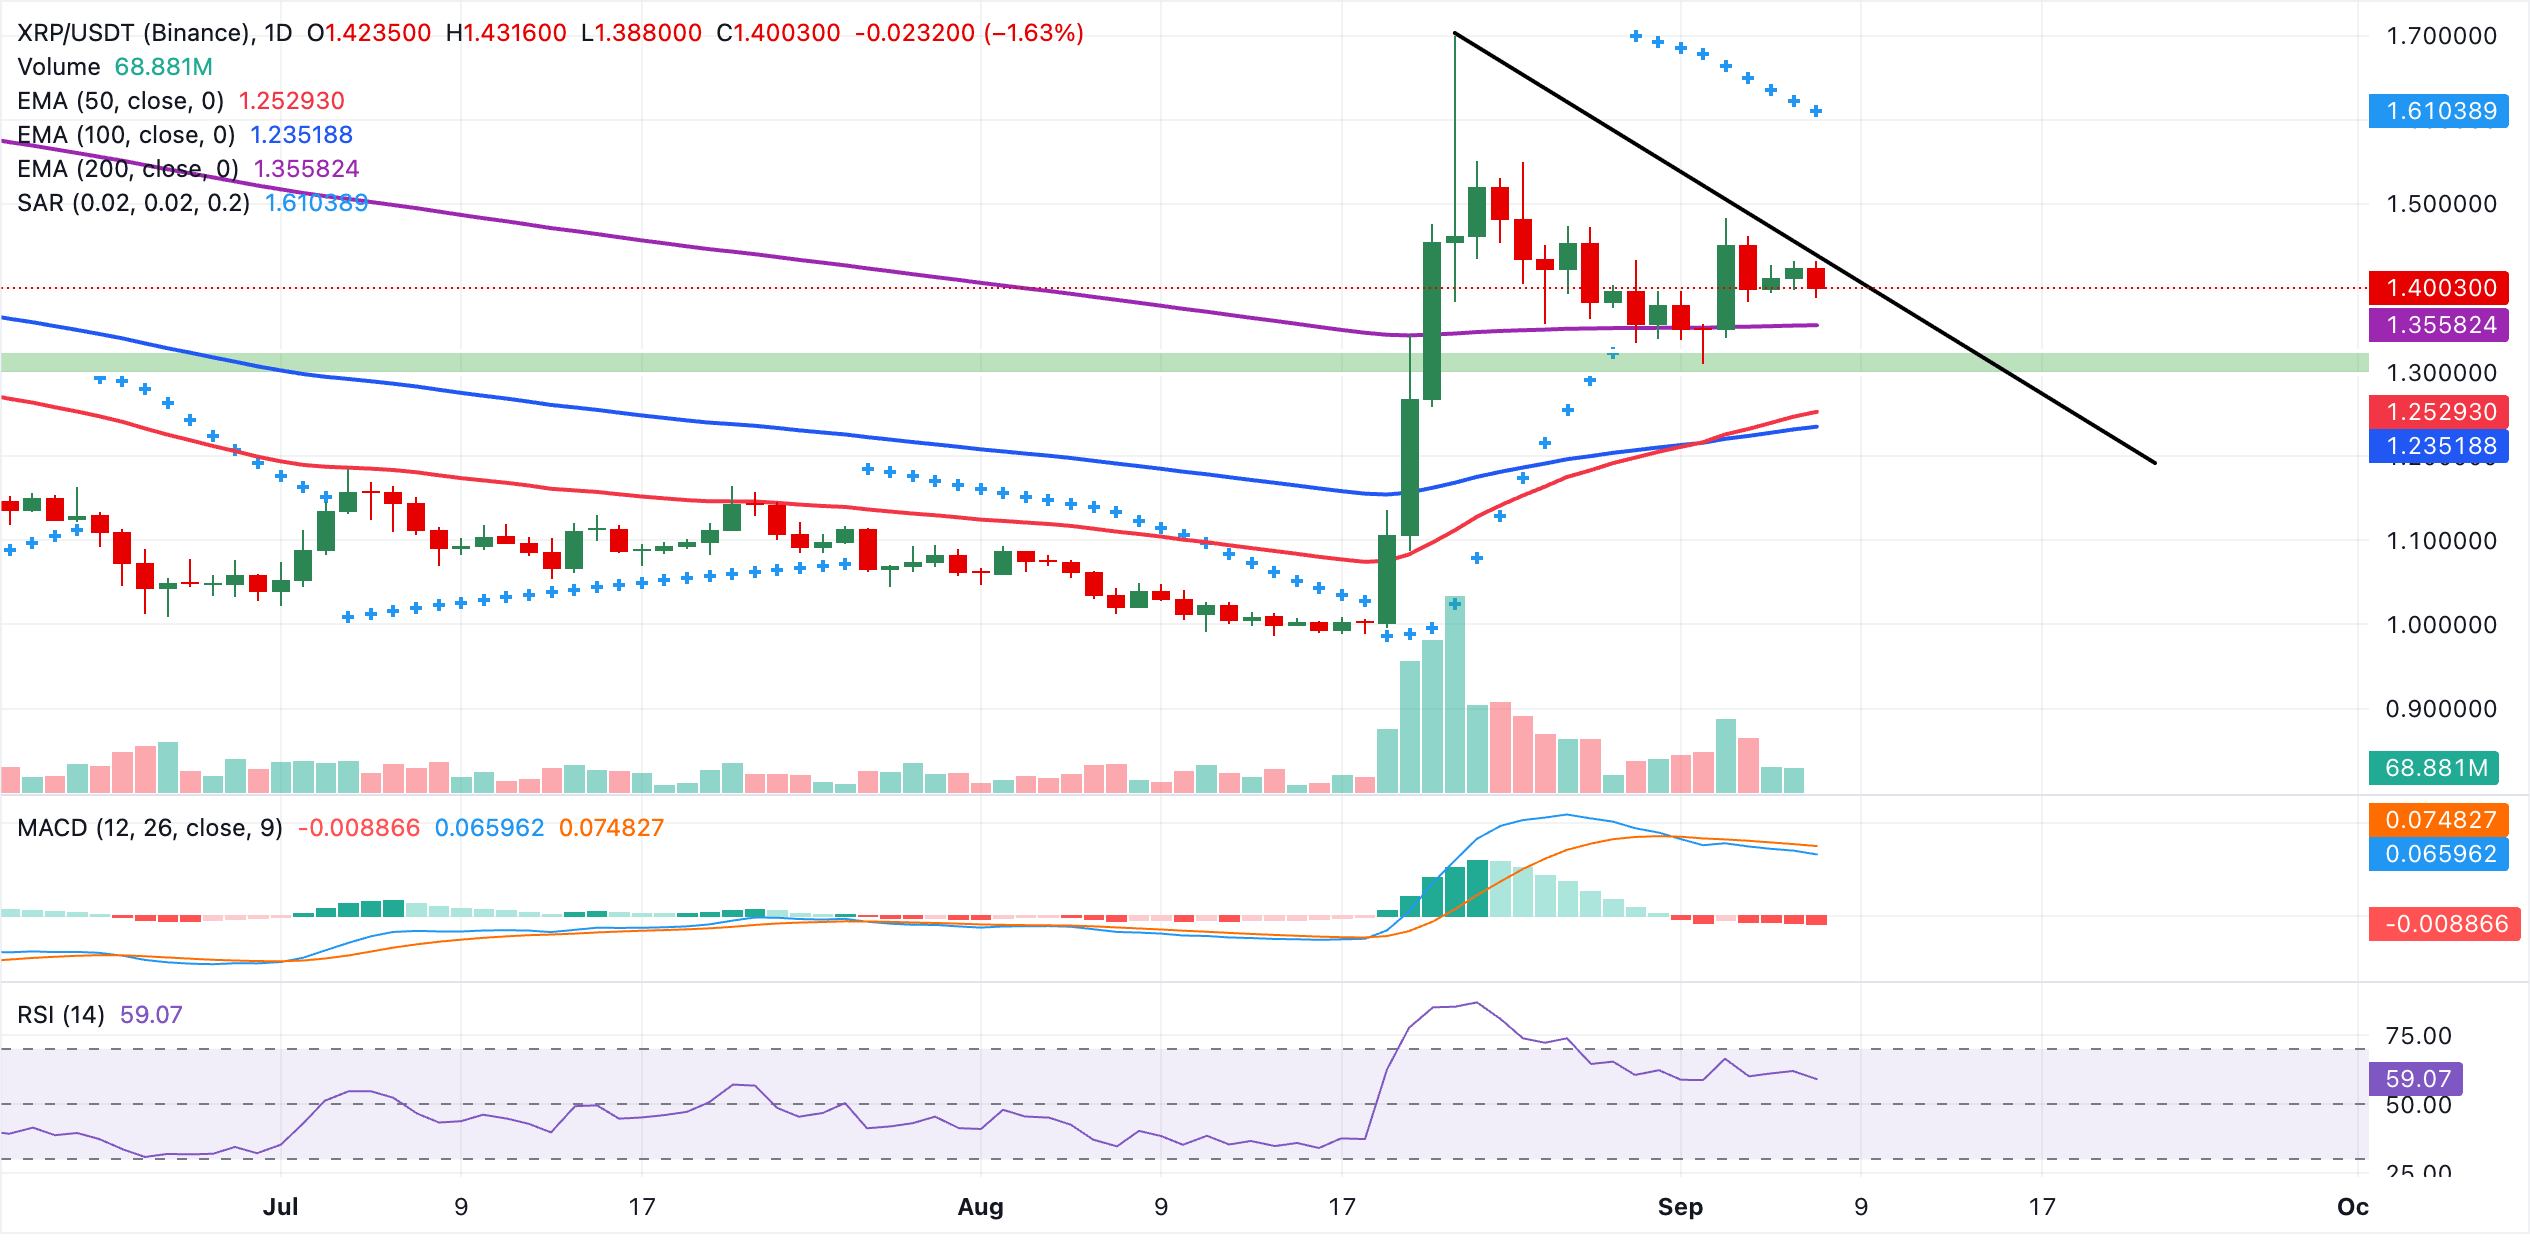
On the topside, immediate resistance lies at the downward trendline break level around $1.43, with the Parabolic SAR near $1.61 acting as a higher barrier if buyers extend the move. On the downside, initial support is aligned with the 200-day EMA near $1.36, ahead of a wider demand zone defined by the 50-day EMA at $1.25 and the 100-day EMA at $1.24, where dip-buying interest could re-emerge if the pair corrects lower.
(The technical analysis of this story was written with the help of an AI tool. Know more.)