- XRP struggles around the 100-day EMA as volatility spreads across the cryptocurrency market.
- US Jobless Claims totaled 218K for the week ending September 20, significantly less than the 235K expected.
- XRP and the broader crypto market remain on edge, reflecting weak sentiment heading into the fourth quarter.
Ripple (XRP) has been fluctuating between a narrow range of support at $2.83 and resistance at $2.93 on Thursday. The correction that began at the start of the week reflects weak sentiment in the broader cryptocurrency market amid mixed signals from key United States (US) economic data.
Falling US jobless claims drag XRP, crypto prices down
US Initial Jobless Claims for the week that ended September 20 were 218,000, as reported by the Labor Department on Thursday. They also came below the market expectation of 235,000 and down 14,000 from the previous upwardly revised figure of 232,000.
The release comes a week after the Federal Reserve (Fed) lowered interest rates by 25 basis points, bringing the benchmark borrowing rate to a range of 4.00 to 4.25%.
Fed Chair Jerome Powell stated after the September 17 Federal Open Market Committee (FOMC) meeting that a softening labor market was among the key reasons for the monetary policy pivot.
Other key economic data, such as the US Gross Domestic Product (GDP) annualized growth rate (final), was 3.8%, beating market expectations and the previous release of 3.3%. The Q2 Personal Consumption Expenditures (PCE) price index was 2.6%, above market expectations and the previous release of 2.5%.
The drop in jobless claims underscores a resilient labor market, which could reduce the central bank’s urgency to cut rates further despite job gains falling to 22,000 in August. Furthermore, the PCE price index, which rose to 2.6%, suggests sticky inflation, exceeding the Fed’s target of 2%.
Investors in riskier assets, such as crypto, are expecting the Fed to continue cutting rates in the fourth quarter, which would drive liquidity into the market and keep prices elevated. Still, mixed signals from key economic data could further complicate the central bank’s dual mandate of managing inflation and supporting the labor market.
XRP has fallen nearly 8% since September 17, reflecting a decline in the demand for risk assets. Upcoming economic data, like the August Core PCE price index on Friday, could provide investors with insight into the direction of the central bank’s monetary policy for the fourth quarter.
For now, risk-off sentiment prevails with XRP struggling to uphold support at $2.83. Recovery above the $3.00 remains uncertain; the XRP technical picture could provide more answers.
Technical outlook: Is XRP poised to recover or extend the correction?
XRP is delicately holding onto support at $2.83, provided by the 100-day Exponential Moving Average (EMA), after facing rejection at the 50-day EMA positioned at $2.94.
The Relative Strength Index (RSI), which holds at 43 in the bearish region, suggests that bullish momentum is fading. Lower RSI readings would make recovery increasingly difficult.
A sell signal maintained by the Moving Average Convergence Divergence (MACD) indicators since Monday reinforces the bearish grip. Investors will likely continue to reduce their exposure with the blue line remaining below the red signal line, contributing to selling pressure.
Below the 100-day EMA support at $2.83, traders would shift their attention to the 200-day EMA at $2.60 to provide additional support to prevent declines beneath the key round-figure number of $2.50.
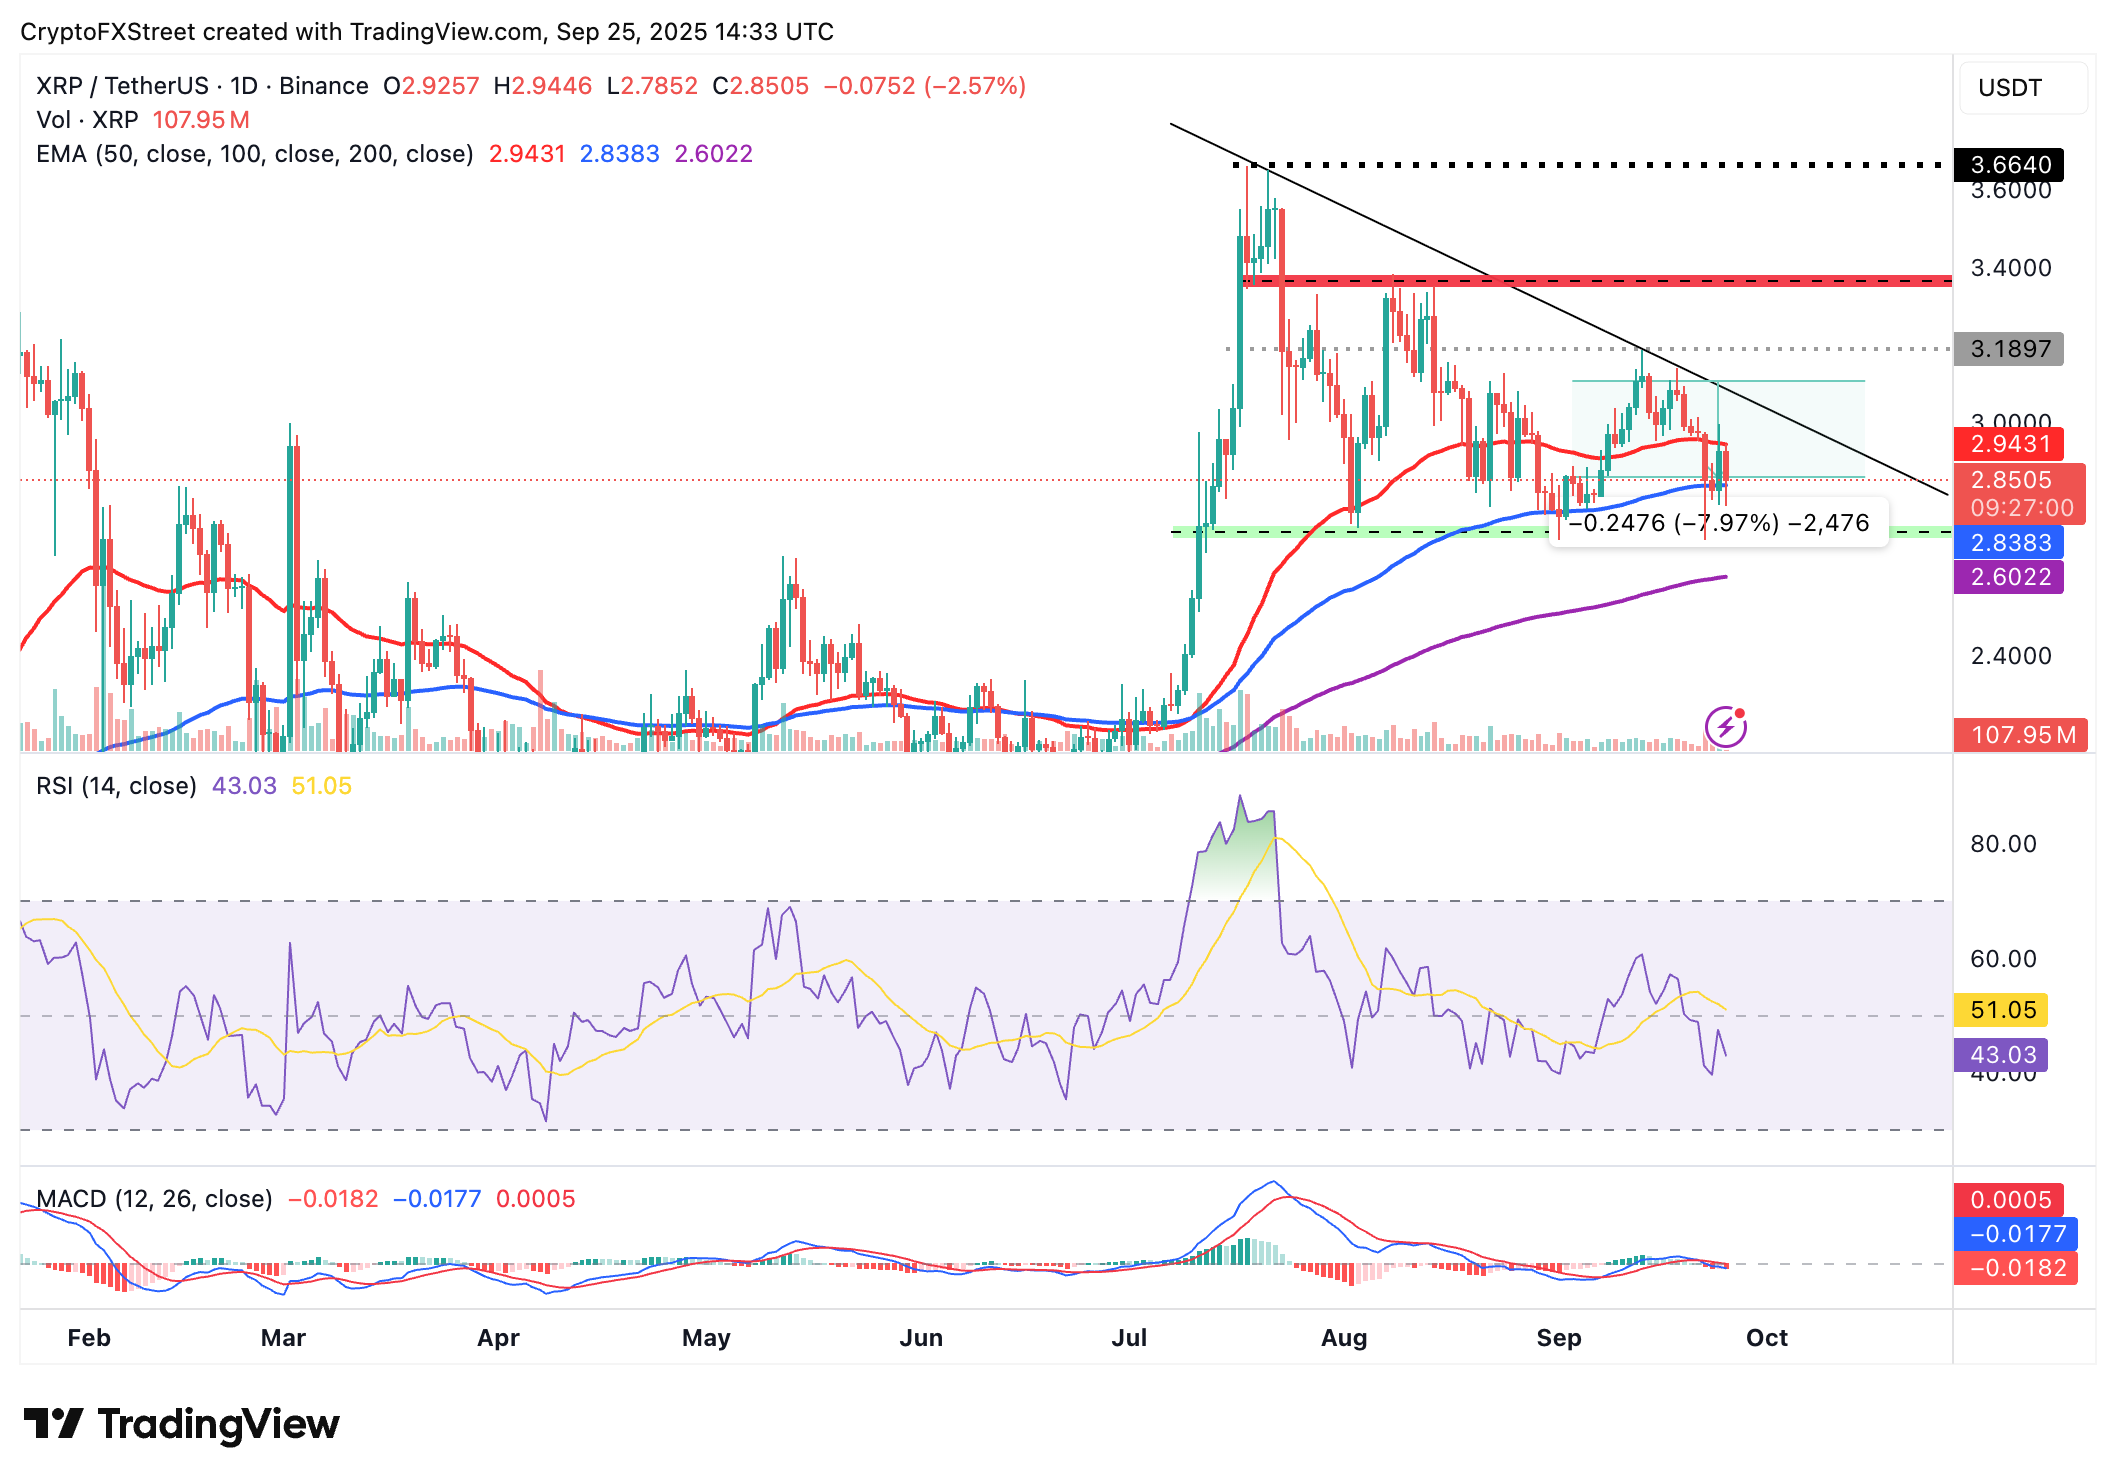
XRP/USDT daily chart
Still, investors would anticipate another breakout attempt from the short-term support at $2.83. A successful break above the 50-day EMA at $2.94 would back a short-term bullish outlook. To break the downward-tilted trend, bulls must push above the overall downtrend marked by a descending trendline since late July.
Cryptocurrency prices FAQs
Source