The United States (US) Bureau of Economic Analysis (BEA) will publish the Personal Consumption Expenditures (PCE) Price Index data for May on Thursday at 12:30 GMT.
The PCE Price Index is closely watched by market participants because it is the Federal Reserve’s (Fed) preferred measure of inflation and could influence its policy outlook.
Anticipating the PCE: Insights into the Federal Reserve’s key inflation metric
The core PCE Price Index, which excludes volatile food and energy prices, is expected to advance 0.3% month-over-month (MoM) in May, following the 0.2% increase recorded in April.
In the 12 months to May, the core PCE inflation is set to edge higher to 3.4%. Meanwhile, the headline annual PCE inflation is forecast to reach its highest level since May 2023 at 4%.
Markets will scrutinize the PCE Price Index data as Fed officials take this inflation gauge into account when deciding on the next policy move. Although crude Oil prices declined sharply and almost returned to pre-war levels since the United States (US) and Iran reached a framework deal to reopen the Strait of Hormuz, markets remain convinced that the Fed will need to tighten its policy in the second half of the year, given the healthy labor market conditions and the uncertainty regarding how quickly the disinflation process could restart.
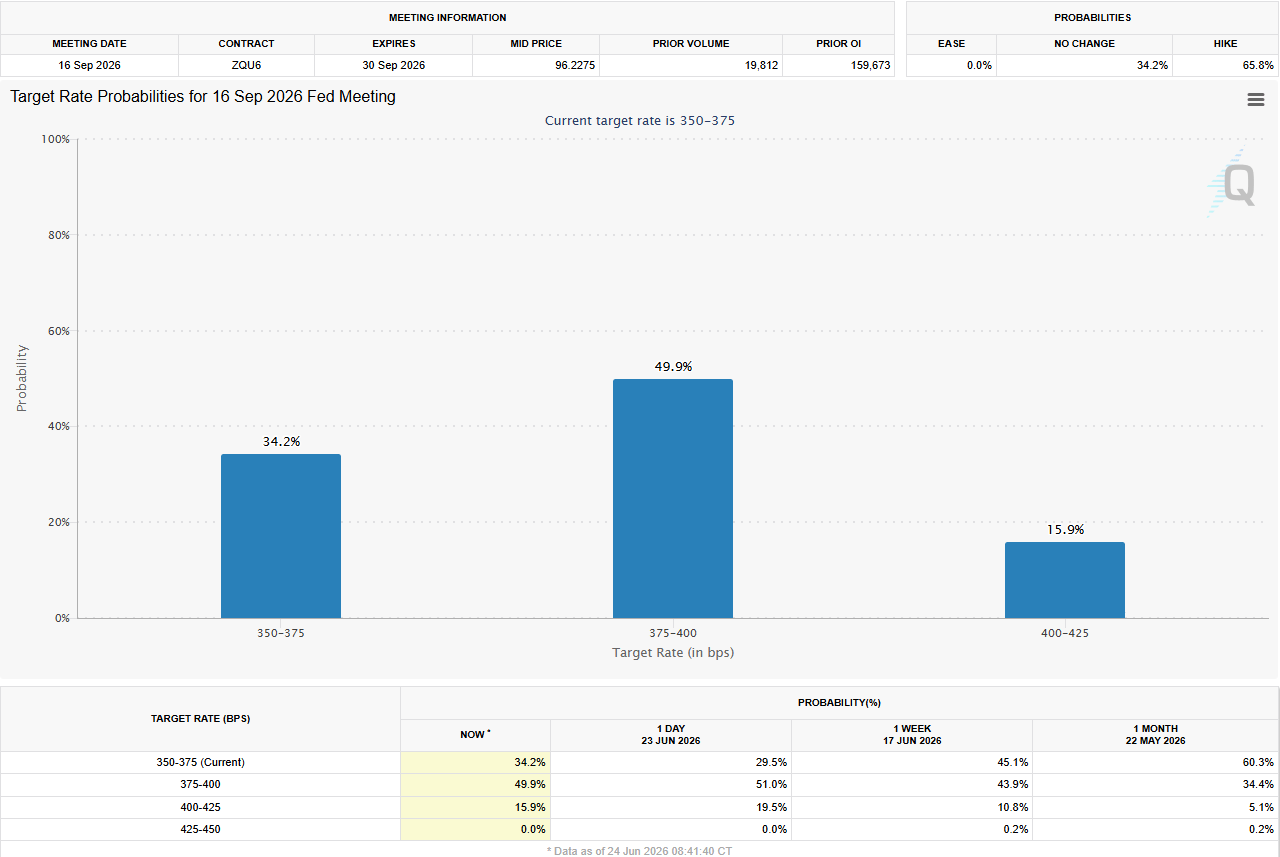
According to the CME FedWatch Tool, markets are currently pricing in about a 65% probability that the Fed will raise borrowing costs by at least 25 basis points (bps) by September.
The revised Summary of Economic Projections (SEP), published alongside the monetary policy statement after the June Federal Open Market Committee (FOMC) meeting, showed that policymakers forecast PCE inflation to stand at 3.6% by year-end, and see the core PCE inflation at 3.3%.
Previewing the PCE inflation report, a TD Securities analyst said:
“We expect core PCE prices to show strong services inflation in May despite weak goods prices, as tariff passthrough has largely dissipated. Headline PCE will be higher at 0.49% m/m due to energy prices. Our forecast assumes 0.55% m/m for supercore after a strong PPI for the month. We look for personal spending to grow 0.5%, which reflects a moderation in real terms to 0.0%.”
How will the Personal Consumption Expenditures Price Index affect EUR/USD?
The US Dollar (USD) Index, which gauges the Greenback’s performance against a basket of six major currencies, is up more than 2.5% in June and has recently reached its highest level in over a year, above 101.50. Hawkish revisions seen in the Fed’s SEP, new Fed Chairman Kevin Warsh’s cautious and ambiguous comments on the policy outlook, combined with surprisingly upbeat macroeconomic data releases from the US, fuelled expectations for a Fed rate hike and drove the USD’s latest leg higher.
For markets to shift their view on the Fed policy outlook in a significant way, a softer-than-PCE inflation reading might not be enough. Still, a negative surprise in the monthly core PCE print could limit the USD’s gains and help EUR/USD hold its ground in the immediate term, but such a market reaction is likely to be short-lived. Conversely, a figure of 0.4% or bigger could fuel September Fed rate hike bets and cause EUR/USD to stretch its downtrend.
Eren Sengezer, European Session Lead Analyst at FXStreet, shares a brief technical outlook for EUR/USD:
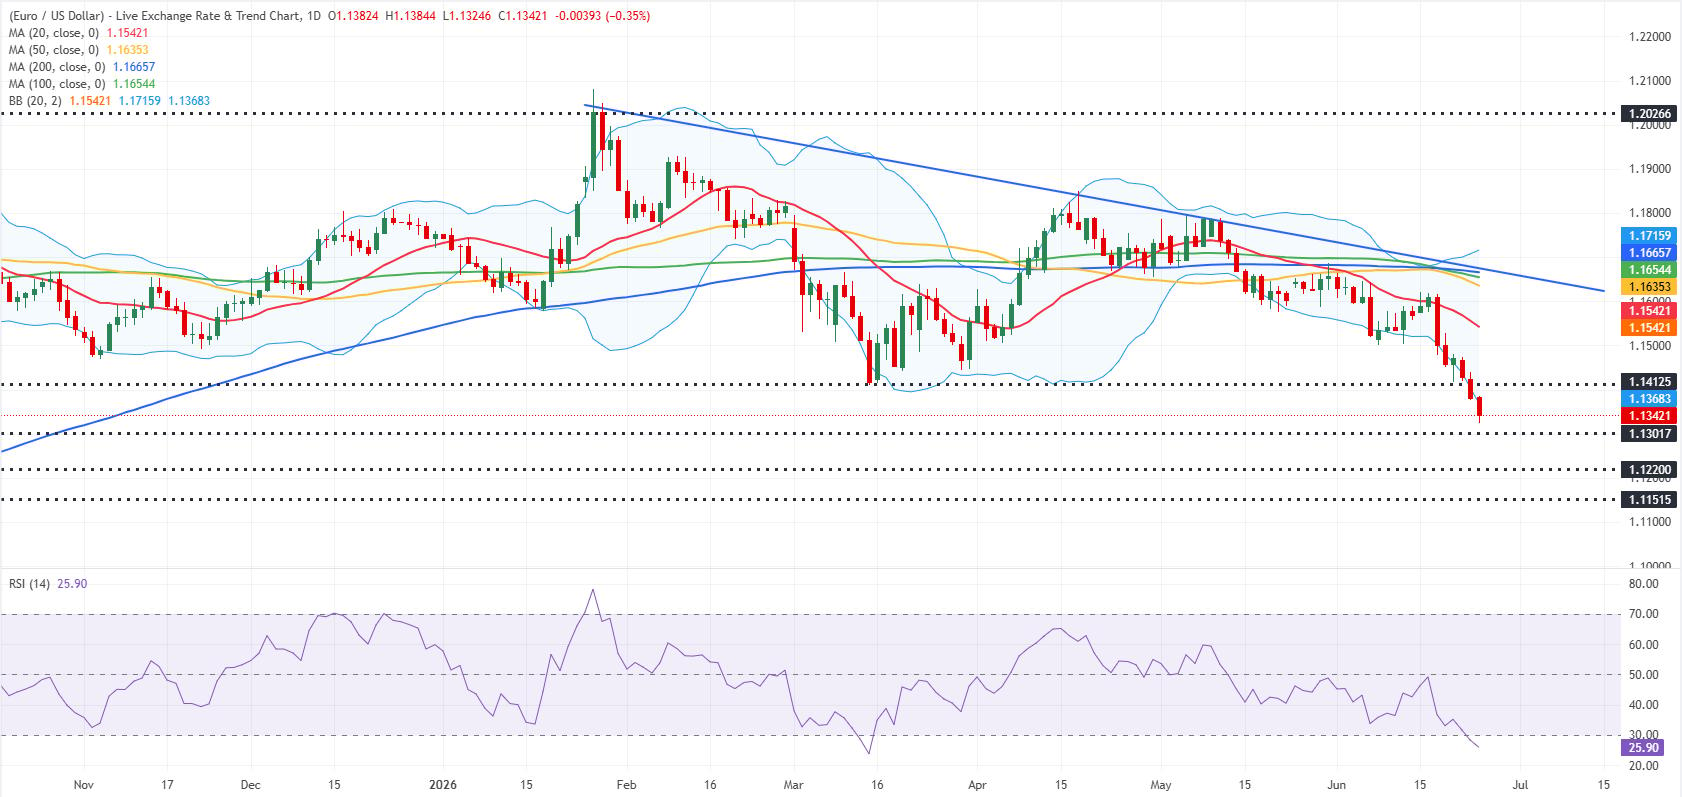
“The near-term technical outlook for EUR/USD reaffirms the bearish stance but highlights oversold conditions. The Relative Strength Index (RSI) indicator on the daily chart stays below 30 and the pair trades slightly below the lower arm of the Bollinger Bands. This setup suggests that there could be a technical correction before there is an extended slide.”
“On the downside, 1.1300 (static level, round level) aligns as the first support level before 1.1220 (static level) and 1.1150 (static level). In case the pair stages a correction, 1.1410/1.1400 (former support level, round level) could be seen as the immediate resistance area ahead of 1.1540 (Bollinger Bands mid-point) and 1.1660-1.1670 (upper arm of the Bollinger Bands, 200-day Simple Moving Average SMA, 100-day SMA).”
US Dollar FAQs
The US Dollar (USD) is the official currency of the United States of America, and the ‘de facto’ currency of a significant number of other countries where it is found in circulation alongside local notes. It is the most heavily traded currency in the world, accounting for over 88% of all global foreign exchange turnover, or an average of $6.6 trillion in transactions per day, according to data from 2022.
Following the second world war, the USD took over from the British Pound as the world’s reserve currency. For most of its history, the US Dollar was backed by Gold, until the Bretton Woods Agreement in 1971 when the Gold Standard went away.
The most important single factor impacting on the value of the US Dollar is monetary policy, which is shaped by the Federal Reserve (Fed). The Fed has two mandates: to achieve price stability (control inflation) and foster full employment. Its primary tool to achieve these two goals is by adjusting interest rates.
When prices are rising too quickly and inflation is above the Fed’s 2% target, the Fed will raise rates, which helps the USD value. When inflation falls below 2% or the Unemployment Rate is too high, the Fed may lower interest rates, which weighs on the Greenback.
In extreme situations, the Federal Reserve can also print more Dollars and enact quantitative easing (QE). QE is the process by which the Fed substantially increases the flow of credit in a stuck financial system.
It is a non-standard policy measure used when credit has dried up because banks will not lend to each other (out of the fear of counterparty default). It is a last resort when simply lowering interest rates is unlikely to achieve the necessary result. It was the Fed’s weapon of choice to combat the credit crunch that occurred during the Great Financial Crisis in 2008. It involves the Fed printing more Dollars and using them to buy US government bonds predominantly from financial institutions. QE usually leads to a weaker US Dollar.
Quantitative tightening (QT) is the reverse process whereby the Federal Reserve stops buying bonds from financial institutions and does not reinvest the principal from the bonds it holds maturing in new purchases. It is usually positive for the US Dollar.